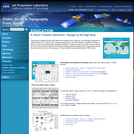
In this activity, students examine a pair of satellite images of the …
In this activity, students examine a pair of satellite images of the ocean and determine whether there is a relationship between the height of ocean waves and the sea level. Data from the two images are plotted side by side and students discuss the reasons for their findings. The resource includes the images and a student worksheet. Summary background information, data and images supporting the activity are available on the Earth Update data site. To complete the activity, students will need to access the Space Update multimedia collection, which is available for download and purchase for use in the classroom.
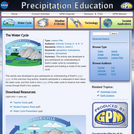
In this activity, students analyze regions of sea ice using data and …
In this activity, students analyze regions of sea ice using data and ImageJ software. They measure ice mass and calculate effective albedo, and plot changes in solar energy and water/ice cover percentages. This is part 4 of a four-part activity on polar science. Data access information is provided in the attached appendix. This activity is one of several learning activities connected with the 2007 GLOBE Earth system poster.
This activity demonstrates how to import data from the Internet and make …
This activity demonstrates how to import data from the Internet and make EXCEL graphs. The instructions included were provided by a classroom teacher who used these instructions with high school students.
In this activity, student teams learn about research design and design a …
In this activity, student teams learn about research design and design a controlled experiment exploring the relationship between a hypothetical planet, an energy source, and distance. They analyze the data and derive an equation to describe the observations. Includes student data sheets, a teacher's guide, and a tutorial on how to use the spreadsheet program Excel. This is Activity A in module 3, titled "Using Mathematic Models to Investigate Planetary Habitability," of the resource, Earth Climate Course: What Determines a Planet's Climate? The course aims to help students to develop an understanding of our environment as a system of human and natural processes that result in changes that occur over various space and time scales.
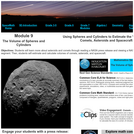
In this activity, students build a simple computer model to determine the …
In this activity, students build a simple computer model to determine the black body surface temperature of planets in our solar system: Mercury, Venus, Earth, Mars, Jupiter, Saturn, Uranus, Neptune and Pluto. Experiments altering the luminosity and distance to the light source will allow students to determine the energy reaching the object and its black body temperature. The activity builds on student outcomes from activity A, "Finding a Mathematical Description of a Physical Relationship." It also supports inquiry into a real-world problem, the effect of urban heat islands and deforestation on climate. Includes a teacher's guide, student worksheets, and an Excel tutorial. This is Activity B of module 3, titled "Using Mathematic Models to Investigate Planetary Habitability," of the resource, Earth Climate Course: What Determines a Planet's Climate? The course aims to help students to develop an understanding of our environment as a system of human and natural processes that result in changes that occur over various space and time scales.
Students explore how mathematical descriptions of the physical environment can be fine-tuned …
Students explore how mathematical descriptions of the physical environment can be fine-tuned through testing using data. In this activity, student teams obtain satellite data measuring the Earth's albedo, and then input this data into a spreadsheet-based radiation balance model, GEEBITT. They validate their results against published the published albedo value of the Earth, and conduct similar comparisons Mercury, Venus and Mars. The resource includes an Excel spreadsheet tutorial, an investigation, student data sheets and a teacher's guide. Students apply their understanding to the real life problem of urban heat islands and deforestation. The activity links builds on student outcomes from activities A and B: "Finding a Mathematical Description of a Physical Relationship," and "Making a Simple Mathematical Model." This is Activity C in module 3, Using Mathematical Models to Investigate Planetary Habitability, of the resource, Earth Climate Course: What Determines a Planet's Climate? The course aims to help students to develop an understanding of our environment as a system of human and natural processes that result in changes that occur over various space and time scales.
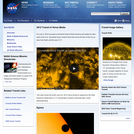
This is a lesson about using radar to search for water on …
This is a lesson about using radar to search for water on the Moon. Learners will use images to search for water on the moon. Additionally they will learn how Mini-RF can identify surface features that are permanently shadowed, or lack any visible evidence of surface morphology.
This is a lesson about elemental spectra. Learners will compare known elemental …
This is a lesson about elemental spectra. Learners will compare known elemental spectra with spectra of Titan and Saturn’s rings from a spectrometer aboard the NASA Cassini spacecraft. They identify the elements visible in the planetary and lunar spectra. The activity is part of Project Spectra, a science and engineering program for middle-high school students, focusing on how light is used to explore the Solar System.
This is an activity about the phases of Venus and the planet’s …
This is an activity about the phases of Venus and the planet’s variance in angular size as seen from Earth. Learners will use an online program such as Solar System Live to determine Venus’s distance from Earth for one half of its cycle. This activity requires access to the Solar System Update software and a computer with Internet access. This is Solar System Activity 6 in a larger resource, Space Update.
This is an activity about the Venus Transit and how it helped …
This is an activity about the Venus Transit and how it helped astronomers determine the scale of the solar system. Learners will use measurement, ratios, and graphing to construct a model of the solar system and determine the relationship of each planet to the Sun. They will explore the scales needed to represent the size of the planets and the distances to the Sun. This activity corresponds to the NASA CONNECT video, titled Venus Transit, and has supplemental questions to support the video viewing.
This is a lesson about the vertical dimension of the atmosphere and …
This is a lesson about the vertical dimension of the atmosphere and includes four activities. Activity 1 Introduces concepts related to distance, including length and height and units of measurement. Students are asked to make comparisons of distances. In activity 2, students learn about the vertical profile of the atmosphere. They work with a graph and plot the heights of objects and the layers of the atmosphere: troposphere, stratosphere, mesosphere, thermosphere, and exosphere. In activity 3, students learn about other forms of visual displays using satellite imagery. They compare images of the same weather feature, a hurricane, using two different images from MODIS and CALIPSO. One image is looking down on the hurricane from space, the other looks through the hurricane to display a profile of the hurricane. Activity 4 reinforces the concept of the vertical nature of the atmosphere. Students will take a CALIPSO satellite image that shows a profile of the atmosphere and use this information to plot mountains and clouds on their own graph of the atmosphere. The recommended order for the activities is to complete the first two activities on day one, and the second two activities on day two. Each day will require approximately 1 to 1.5 hours.
Atmospheric scientists use computer models to forecast the position of a moving …
Atmospheric scientists use computer models to forecast the position of a moving volcanic cloud, and remote sensing can identify its components, including gases and aerosols. This resource provides ideas for classroom investigation of these topics, and directions for a demonstration of light scattering by aerosols. The lesson ideas are from PUMAS - Practical Uses of Math and Science - a collection of brief examples created by scientists and engineers showing how math and science topics taught in K-12 classes have real world applications.
In this activity, students use satellite imagery to assess potential danger associated …
In this activity, students use satellite imagery to assess potential danger associated with selecting a new and safer location for the town of Villarrica, along with its corresponding communication and evacuation routes. Satellite imagery and a topographic map are included. The resource is from PUMAS - Practical Uses of Math and Science - a collection of brief examples created by scientists and engineers showing how math and science topics taught in K-12 classes have real world applications.
This is a set of three, one-page problems about calculating the volume …
This is a set of three, one-page problems about calculating the volume of objects. Learners may calculate the volume of an asteroid, Vesta, or the stacking of satellites inside an atlas V rocket nose cone. Options are presented so that students may learn about the Dawn mission to asteroid Vesta through a NASA press release or about NASA's investigation of comets by viewing a NASA eClips video [5 min.]. This activity is part of the Space Math multi-media modules that integrate NASA press releases, NASA archival video, and mathematics problems targeted at specific math standards commonly encountered in middle school.
This game is suitable for play both within and outside of the …
This game is suitable for play both within and outside of the classroom, and although designed for children ages 9-13, it offers a fun, learning opportunity for the entire family. In addition to being a game, it is an eye-catching poster showing continents, oceans and all of the major ocean currents. On the reverse, there are black and white educational activities designed to be reproduced directly from the poster for use in the classroom.
In this demonstration, a plastic soft drink bottle is used to demonstrate …
In this demonstration, a plastic soft drink bottle is used to demonstrate properties of gases and liquids with respect to temperature and pressure. Calculations using the formula for the Ideal Gas Law are included. The resource is from PUMAS - Practical Uses of Math and Science - a collection of brief examples created by scientists and engineers showing how math and science topics taught in K-12 classes have real world applications.
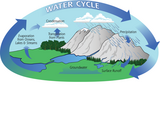
This lesson was developed to give participants an understanding of Earth's water …
This lesson was developed to give participants an understanding of Earth's water cycle. In this one-hour long activity, students participate in a webquest to learn about the water cycle, and then build a mini-model of the water cycle to observe how water moves through Earth's four systems. The activity uses the 5E instructional model and is part of the "Survivor Earth" series of one-hour lessons.
This is a hands-on lab activity about the water cycle, specifically evaporation …
This is a hands-on lab activity about the water cycle, specifically evaporation and condensation. Using materials such as clay, ice and a lamp, learners will observe the relationship between temperature and condensation and temperature and evaporation. They will then draw a diagram or a concept map of the water cycle. Background information, common preconceptions, a glossary and more is included. This activity is part of the Aquarius Hands-on Laboratory Activities.
In this problem-based learning module, students work in teams to examine a …
In this problem-based learning module, students work in teams to examine a broad array of information related to water quality in Lower Wheeling Creek and the Wheeling Creek watersheds in Wheeling, West Virginia. This module is part of Exploring the Environment.
No restrictions on your remixing, redistributing, or making derivative works. Give credit to the author, as required.
Your remixing, redistributing, or making derivatives works comes with some restrictions, including how it is shared.
Your redistributing comes with some restrictions. Do not remix or make derivative works.
Most restrictive license type. Prohibits most uses, sharing, and any changes.
Copyrighted materials, available under Fair Use and the TEACH Act for US-based educators, or other custom arrangements. Go to the resource provider to see their individual restrictions.