Student teams design, build and test small-sized gliders to maximize flight distance …
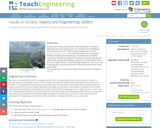
Student teams design, build and test small-sized gliders to maximize flight distance and an aerodynamic ratio, applying their knowledge of fluid dynamics to its role in flight. Students experience the entire engineering design process, from brainstorming to CAD (or by hand) drafting, including researching (physics of aerodynamics and glider components that take advantage of that science), creating materials lists, constructing, testing and evaluating—all within constraints (works with a launcher, budget limitation, maximizing flight distance to mass ratio), and concluding with a summary final report. Numerous handouts and rubrics are provided.
This short video discusses where carbon dioxide, the gas that is mainly …
This short video discusses where carbon dioxide, the gas that is mainly responsible for warming up our planet and changing the climate, comes from. It discusses how the rise in atmospheric carbon dioxide comes directly from the burning of fossil fuels and indirectly from the human need for energy.
This activity is a guided inquiry of how molecules move in liquid. …
This activity is a guided inquiry of how molecules move in liquid. Students develop questions, use their observation skills to describe what they saw, record and analyze their findings, and use their data to begin to hypothesize what is happening in the investigation.
This activity is a lab inquiry-base lesson on the rock cycle. Students …
This activity is a lab inquiry-base lesson on the rock cycle. Students will look at the parts of the rock cycle by examining three rocks. Based on their observations and data they collect they should be able to develop a hypothesis and an experiment to test this hypothesis.
In this activity, students create two- and three-dimensional maps by using a …
In this activity, students create two- and three-dimensional maps by using a data grid of an imaginary section of Earth's surface. They are challenged to create six different maps of various surface features and answer questions about them.
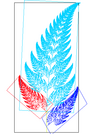
This applied mathematics textbook covers Matrices and Pathways, Statistics and Probability, Finance, …
This applied mathematics textbook covers Matrices and Pathways, Statistics and Probability, Finance, Cyclic, Recursive and Fractal Patterns, Vectors, and Design. The approach used is primarily data driven, using numerical and geometrical problem-solving techniques.
The Process of Science Companion is composed of the following four books: …
The Process of Science Companion is composed of the following four books: Science Communication; Scientific Group Collaboration; Data Analysis, Statistics, and Experimental Design; Tools and Techniques. These resources provide support for students doing independent research.
Students become familiar with the engineering design process as they design, build …
Students become familiar with the engineering design process as they design, build and test chair prototypes. The miniature chairs must be sturdy and functional enough to hold a wooden, hinged artist model or a floppy stuffed animal. They use their prototypes to assess design strengths and weaknesses.
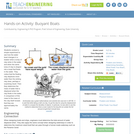
Students are challenged to design and program Arduino-controlled robots that behave like …
Students are challenged to design and program Arduino-controlled robots that behave like simple versions of the automated guided vehicles engineers design for real-world applications. Using Arduino microcontroller boards, infrared (IR) sensors, servomotors, attachable wheels and plastic containers (for the robot frame), they make "Lunch-Bots." Teams program the robots to meet the project constraints—to follow a line of reflective tape, make turns and stop at a designated spot to deliver a package, such as a sandwich or pizza slice. They read and interpret analog voltages from IR sensors, compare how infrared reflects differently off different materials, and write Arduino programs that use IR sensor inputs to control the servomotors. Through the process, students experience the entire engineering design process. Pre/post-quizzes and coding help documents are provided.
Students explore the idea that not all straight lines are proportional by …
Students explore the idea that not all straight lines are proportional by comparing a graph representing a stack of books with a graph representing a stack of cups. They recognize that all proportional relationships are represented as a straight line that passes through the origin.Key ConceptsNot all graphs of straight lines represent proportional relationships.There are three ways to tell whether a relationship between two varying quantities is proportional:The graph of the relationship between the quantities is a straight line that passes through the point (0, 0).You can express one quantity in terms of the other using a formula of the form y = kx.The ratios between the varying quantities are constant.Goals and Learning ObjectivesUnderstand when a graph of a straight line is and when it is not a proportional relationship.Recognize that a proportional relationship is shown on a graph as a straight line that passes through the origin (0, 0).Make a table of values to represent two quantities that vary.Graph a table of values representing two quantities that vary.Describe what each variable and number in a formula represents.
Lesson OverviewStudents calculate the constant of proportionality for a proportional relationship based …
Lesson OverviewStudents calculate the constant of proportionality for a proportional relationship based on a table of values and use it to write a formula that represents the proportional relationship.Key ConceptsIf two quantities are proportional to one another, the relationship between them can be defined by a formula of the form y = kx, where k is the constant ratio of y-values to corresponding x-values. The same relationship can also be defined by the formula x=(1k)y , where 1k is now the constant ratio of x-values to y-values.Goals and Learning ObjectivesDefine the constant of proportionality.Calculate the constant of proportionality from a table of values.Write a formula using the constant of proportionality.
This video segment adapted from Last Oasis explores the use of new …
This video segment adapted from Last Oasis explores the use of new dams as a way to provide or store water. In the 1990s, the city of Denver was looking for a new source of water for its growing population, and its plan to build a new dam suddenly became highly controversial.
With an introduction to the ideas of energy, students discuss specific types …
With an introduction to the ideas of energy, students discuss specific types of energy and the practical sources of energy. Hands-on activities help them identify types of energy in their surroundings and enhance their understanding of energy.
This six-day lesson provides students with an introduction to the importance of …
This six-day lesson provides students with an introduction to the importance of energy in their lives and the need to consider how and why we consume the energy we do. The lesson includes activities to engage students in general energy issues, including playing an award-winning Energy Choices board game, and an optional graphing activity that provides experience with MS Excel graphing and perspectives on how we use energy and how much energy we use.
Students conduct a simple experiment to see how the water level changes …
Students conduct a simple experiment to see how the water level changes in a beaker when a lump of clay sinks in the water and when the same lump of clay is shaped into a bowl that floats in the water. They notice that the floating clay displaces more water than the sinking clay does, perhaps a surprising result. Then they determine the mass of water that is displaced when the clay floats in the water. A comparison of this mass to the mass of the clay itself reveals that they are approximately the same.
Students randomly select jelly beans (or other candy) that represent genes for …
Students randomly select jelly beans (or other candy) that represent genes for several human traits such as tongue-rolling ability and eye color. Then, working in pairs (preferably of mixed gender), students randomly choose new pairs of jelly beans from those corresponding to their own genotypes. The new pairs are placed on toothpicks to represent the chromosomes of the couple's offspring. Finally, students compare genotypes and phenotypes of parents and offspring for all the "couples" in the class. In particular, they look to see if there are cases where parents and offspring share the exact same genotype and/or phenotype, and consider how the results would differ if they repeated the simulation using more than four traits.
Explore the forces at work when you try to push a filing …
Explore the forces at work when you try to push a filing cabinet. Create an applied force and see the resulting friction force and total force acting on the cabinet. Charts show the forces, position, velocity, and acceleration vs. time. View a Free Body Diagram of all the forces (including gravitational and normal forces).
The activity begins with an explanation of the Caesar Shift for message …
The activity begins with an explanation of the Caesar Shift for message encryption (Singh, 1999). The Caesar Shift is a translation of the alphabet; for example, a five-letter shift would code the letter a as f, b as g, … z as e. We describe a five-step process for decoding an encrypted message. First, groups of size 4 construct a frequency table of the letters in two lines of a coded message. Second, students construct a bar chart for a reference message of the frequency of letters in the English language. Third, students create a bar chart of the coded message. Fourth, students visually compare the bar chart of the reference message (step 2) to the bar chart of the coded message (step 3). Based on this comparison, students hypothesize a shift. Fifth, students apply the shift to the coded message.
Sign up for a free account on the Gizmo website (https://www.explorelearning.com/index.cfm?method=Controller.dspFreeAccount) for …
Sign up for a free account on the Gizmo website (https://www.explorelearning.com/index.cfm?method=Controller.dspFreeAccount) for free access to two simulations that were collaboratively developed by the teams at Explore Learning and the Wisconsin Fast Plants Program of the University of Wisconsin-Madison. These simulations replace those previously available on our website that were developed nearly two decades ago and no longer function on modern operating systems. Fast Plants Gizmos were created as a collaboration between ExploreLearning and the Wisconsin Fast Plants Program of the University of Wisconsin-Madison. They weredesigned to support many of the experiments that students can do using Fast Plants seeds and plants. By using these Gizmos in combination with firsthand experiences growing Fast Plants, students can compare simulated growth, development and reproduction with observations of living Fast Plants. In addition, the Gizmos genetic simulation makes it possible for students to gather data from a significantly larger plant population than is typically grown in classrooms. These Gizmos also stand alone, supporting topics both in plant life cycles and Mendelian genetics and can be used by any student. Simulation, Simulations, Genetics, Inheritance
No restrictions on your remixing, redistributing, or making derivative works. Give credit to the author, as required.
Your remixing, redistributing, or making derivatives works comes with some restrictions, including how it is shared.
Your redistributing comes with some restrictions. Do not remix or make derivative works.
Most restrictive license type. Prohibits most uses, sharing, and any changes.
Copyrighted materials, available under Fair Use and the TEACH Act for US-based educators, or other custom arrangements. Go to the resource provider to see their individual restrictions.