The applets in this section of Statistical Java allow you to see …
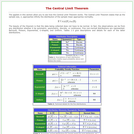
The applets in this section of Statistical Java allow you to see how the Central Limit Theorem works. The main page gives the characteristics of five non-normal distributions (Bernoulli, Poisson, Exponential, U-shaped, and Uniform).
The applets in this section of Statistical Java allow you to see …
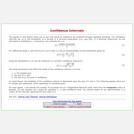
The applets in this section of Statistical Java allow you to see how levels of confidence are achieved through repeated sampling. The confidence intervals are related to the probability of successes in a Binomial experiment.
The applets in this section allow you to see how the common …
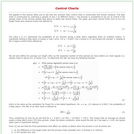
The applets in this section allow you to see how the common Xbar control chart is constructed with known variance. The Xbar chart is constructed by collecting a sample of size n at different times t.
The applets in this section allow you to see how different bivariate …
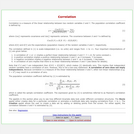
The applets in this section allow you to see how different bivariate data look under different correlation structures. The Movie applet either creates data for a particular correlation or animates a multitude data sets ranging correlations from -1 to 1.
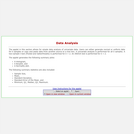
The applet in this section allows for simple data analysis of univariate …
The applet in this section allows for simple data analysis of univariate data. Users can either generate normal or uniform data for k samples or copy and paste data from another source to a text box. A univariate analysis is performed for all k samples.
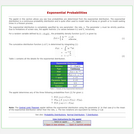
The applet in this section allows you see how probabilities are determined …
The applet in this section allows you see how probabilities are determined from the exponential distribution. The user determines the mean of the distribution and the limits of probability. Three different probability expressions are available.
This text document lists detailed learning objectives for introductory statistics courses. Learning …
This text document lists detailed learning objectives for introductory statistics courses. Learning objectives are brief, clear statements of what learners will be able to perform at the end of a course.
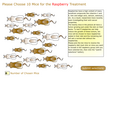
This Flash based applet simulates data from a case study of treatments …
This Flash based applet simulates data from a case study of treatments for tumor growth in mice. This simulation allows the user to place mice into a control and treatment groups.
The applets in this section allow users to see how probabilities and …
The applets in this section allow users to see how probabilities and quantiles are determined from a Normal distribution. For calculating probabilities, set the mean, variance, and limits; for calculating quantiles, set the mean, variance, and probability.
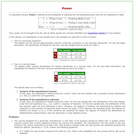
The applets in this section of Statistical Java address Power. Users can …
The applets in this section of Statistical Java address Power. Users can perform one or two tailed tests for proportions or means for one or two samples. Set the parameters and drag the mouse across the graph to see how effect size affects power.
This page of Statistical Java describes 11 different probability distributions including the …
This page of Statistical Java describes 11 different probability distributions including the Binomial, Poisson, Negative Binomial, Geometric, T, Chi-squared, Gamma, Weibull, Log-Normal, Beta, and F. Each distribution has its own applet.
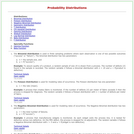
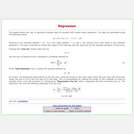
This applet from Statistical Java allows the user to generate bivariate data …
This applet from Statistical Java allows the user to generate bivariate data for analysis with simple linear regression. The page describes the equations used to generate the data and estimate the regression lines.
This material is a detailed exercise for students in introductory statistics. Students …
This material is a detailed exercise for students in introductory statistics. Students are asked to collect a random sample of data from a real estate website; conduct descriptive statistics (including confidence intervals); and write a report summarizing their findings.
Dawson (1995) presented a data set giving a population at risk and …
Dawson (1995) presented a data set giving a population at risk and fatalities for an “unusual episode” (the sinking of the ocean liner Titanic) and discussed the use of the data set in a first statistics course as an elementary exercise in statistical thinking, the goal being to deduce the origin of the data. Simonoff (1997) discussed the use of this data set in a second statistics course to illustrate logistic regression. Moore (2000) used an abbreviated form of the data set in a chapter exercise on the chi-square test. This article describes an activity that illustrates contingency table (two-way table) analysis. Students use contingency tables to analyze the “unusual episode” data (from Dawson 1995) and attempt to use their analysis to deduce the origin of the data. The activity is appropriate for use in an introductory college statistics course or in a high school AP statistics course.
The activity begins with an explanation of the Caesar Shift for message …
The activity begins with an explanation of the Caesar Shift for message encryption (Singh, 1999). The Caesar Shift is a translation of the alphabet; for example, a five-letter shift would code the letter a as f, b as g, … z as e. We describe a five-step process for decoding an encrypted message. First, groups of size 4 construct a frequency table of the letters in two lines of a coded message. Second, students construct a bar chart for a reference message of the frequency of letters in the English language. Third, students create a bar chart of the coded message. Fourth, students visually compare the bar chart of the reference message (step 2) to the bar chart of the coded message (step 3). Based on this comparison, students hypothesize a shift. Fifth, students apply the shift to the coded message.
Students explore the definition and interpretations of the probability of an event …
Students explore the definition and interpretations of the probability of an event by investigating the long run proportion of times a sum of 8 is obtained when two balanced dice are rolled repeatedly. Making use of hand calculations, computer simulations, and descriptive techniques, students encounter the laws of large numbers in a familiar setting. By working through the exercises, students will gain a deeper understanding of the qualitative and quantitative relationships between theoretical probability and long run relative frequency. Particularly, students investigate the proximity of the relative frequency of an event to its probability and conclude, from data, that the dispersion of the relative frequency diminishes on the order .
This activity provides students with 24 histograms representing distributions with differing shapes …
This activity provides students with 24 histograms representing distributions with differing shapes and characteristics. By sorting the histograms into piles that seem to go together, and by describing those piles, students develop awareness of the different versions of particular shapes (e.g., different types of skewed distributions, or different types of normal distributions), that not all histograms are easy to classify, that there is a difference between models (normal, uniform) and characteristics (skewness, symmetry, etc.).
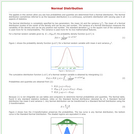
This activity leads students to appreciate the usefulness of simulations for approximating …
This activity leads students to appreciate the usefulness of simulations for approximating probabilities. It also provides them with experience calculating probabilities based on geometric arguments and using the bivariate normal distribution. We have used it in courses in probability and mathematical statistics, as well as in an introductory statistics course at the post-calculus level.
This article describes an interactive activity illustrating sampling distributions for means, properties …
This article describes an interactive activity illustrating sampling distributions for means, properties of confidence intervals, properties of hypothesis testing, confidence intervals for means, and hypothesis tests for means. Students generate and analyze data and through simulation explore these concepts. The activity is completed in three parts. The three parts of the activity can be used in sequence or they can be used individually as stand alone activities. This allows the educator flexibility in utilizing the activity. Part I illustrates the sampling distribution of the sample mean. Part II illustrates confidence intervals for the population mean. Part III illustrates hypothesis tests for the population mean. This activity is appropriate for use in an introductory college or high school AP statistics course.
As teachers of statistics, we know that residual plots and other diagnostics …
As teachers of statistics, we know that residual plots and other diagnostics are important to deciding whether or not linear regression is appropriate for a set of data. Despite talking with our students about this, many students might believe that if the correlation coefficient is strong enough, these diagnostic checks are not important. The data set included in this activity was created to lure students into a situation that looks on the surface to be appropriate for the use of linear regression but is instead based (loosely) on a quadratic function.
No restrictions on your remixing, redistributing, or making derivative works. Give credit to the author, as required.
Your remixing, redistributing, or making derivatives works comes with some restrictions, including how it is shared.
Your redistributing comes with some restrictions. Do not remix or make derivative works.
Most restrictive license type. Prohibits most uses, sharing, and any changes.
Copyrighted materials, available under Fair Use and the TEACH Act for US-based educators, or other custom arrangements. Go to the resource provider to see their individual restrictions.