This video highlights students taking scientific measurements to support investigations in atmospheric …
This video highlights students taking scientific measurements to support investigations in atmospheric science, hydrology, soils, and land cover. It shows students reporting data through the Web, creating scientific visualizations for analysis, and collaborating with students and scientists around the world. This is one of two introductory videos in the 24-part GLOBE video series. GLOBE (Global Learning and Observation to Benefit the Environment) is a worldwide, hands-on, K-12 school-based science education program.
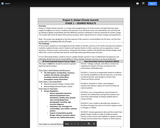
In Global Climate Summit, students are all assigned to be the leaders …
In Global Climate Summit, students are all assigned to be the leaders of specific countries in the world, and they have all been invited to an international environmental summit. Students will research factors in their countries and, using this information, will decide how climate change could affect their country and how their policies could help reduce greenhouse gas emissions. Students then run a global climate summit in class to defend their perspectives and ultimately decide who has the responsibility to reduce climate emissions and how it can be accomplished.
Students create and modify a STELLA model of the global phosphorus cycle …
Students create and modify a STELLA model of the global phosphorus cycle to test a number of scenarios.
(Note: this resource was added to OER Commons as part of a batch upload of over 2,200 records. If you notice an issue with the quality of the metadata, please let us know by using the 'report' button and we will flag it for consideration.)
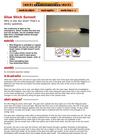
In this activity, learners explore why the sky is blue. Learners model …
In this activity, learners explore why the sky is blue. Learners model the scattering of light by the atmosphere, which creates the blue sky and red sunset, using a flashlight and clear glue sticks. This resource guide includes an explanation of how light scatters and how this scattering can cause the polarization of light.
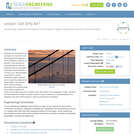
This lesson introduces students to the concepts of air pollution and technologies …
This lesson introduces students to the concepts of air pollution and technologies that have been developed by engineers to reduce air pollution. Students develop an understanding of visible air pollutants with an incomplete combustion demonstration, a "smog in a jar" demonstration, construction of simple particulate matter collectors and by exploring engineering roles related to air pollution. Next, students develop awareness and understanding of the daily air quality and trends in air quality using the Air Quality Index (AQI) listed in the newspaper. Finally, students build and observe a variety of simple models in order to develop an understanding of how engineers use these technologies to clean up and prevent air pollution.
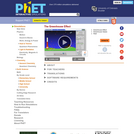
How do greenhouse gases affect the climate? Explore the atmosphere during the …
How do greenhouse gases affect the climate? Explore the atmosphere during the ice age and today. What happens when you add clouds? Change the greenhouse gas concentration and see how the temperature changes. Then compare to the effect of glass panes. Zoom in and see how light interacts with molecules. Do all atmospheric gases contribute to the greenhouse effect?
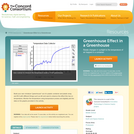
Build your own miniature "greenhouse" out of a plastic container and plastic …
Build your own miniature "greenhouse" out of a plastic container and plastic wrap, and fill it with different things such as dirt and sand to observe the effect this has on temperature. Monitor the temperature using temperature probes and digitally plot the data on the graphs provided in the activity.
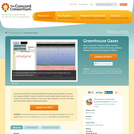
Explore how the Earth's atmosphere affects the energy balance between incoming and …
Explore how the Earth's atmosphere affects the energy balance between incoming and outgoing radiation. Using an interactive model, adjust realistic parameters such as how many clouds are present or how much carbon dioxide is in the air, and watch how these factors affect the global temperature.
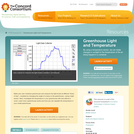
Make your own miniature greenhouse and measure the light levels at different …
Make your own miniature greenhouse and measure the light levels at different "times of day"--modeled by changing the angle of a lamp on the greenhouse--using a light sensor. Next, investigate the temperature in your greenhouse with and without a cover. Learn how a greenhouse works and how you can regulate the temperature in your model greenhouse.
This video segment adapted from Interactive NOVA profiles two scientists who were …
This video segment adapted from Interactive NOVA profiles two scientists who were surprised in 1984 to discover a hole in our atmosphere's ozone layer as big as the United States.
Carbon science researchers and secondary school teachers invite young people to learn about local and global impacts of climate change, explore scientific research on the topic and act locally to reduce emissions of greenhouse gases.
Using thermometers, cotton balls, string and water, students make simple psychrometers—a tool …
Using thermometers, cotton balls, string and water, students make simple psychrometers—a tool that measures humidity. They learn the difference between relative humidity (the ratio of water vapor content to water vapor carrying capacity) and dew point (the temperature at which dew forms). Teams collect data using their homemade psychrometers and then calculate relative humidity inside and outside, comparing their results to an off-the-shelf psychrometer (if available). A lab worksheet is provided for data collection and calculation. As a real-world connection, students learn that humidity and air density is taken into consideration by engineers for many design projects. To conclude, they answer and discuss analysis and application questions.
Students develop their understanding of the effects of invisible air pollutants with …
Students develop their understanding of the effects of invisible air pollutants with a rubber band air test, a bean plant experiment and by exploring engineering roles related to air pollution. In an associated literacy activity, students develop visual literacy and write photograph captions. They learn how images are manipulated for a powerful effect and how a photograph can make the invisible (such as pollutants) visible. Note: You may want to set up the activities for Air Pollution unit, Lessons 2 and 3, simultaneously as they require extended data collection time and can share collection sites.
This resource provides guidance on site selection for the GLOBE Atmosphere data …
This resource provides guidance on site selection for the GLOBE Atmosphere data collection protocols. Instructions for building an instrument shelter, a snowboard, an ozone measurement station, and a wind direction instrument are included.
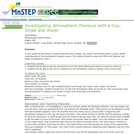
This activity is a reinforcement lab activity where students experiment with ways …
This activity is a reinforcement lab activity where students experiment with ways to get water to flow out of a cup and up a straw causing an imbalance in the atmospheric pressure surrounding the water.
Students identify types and sources of indoor air pollutants in their school …
Students identify types and sources of indoor air pollutants in their school and home environments. They evaluate actions that can be taken to reduce and prevent poor indoor air quality. In an associated literacy activity, students develop a persuasive peer-to-peer case against smoking with the goal to understand how language usage can influence perception, attitudes and behavior.
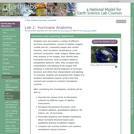
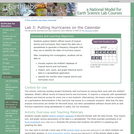
Students view and explore a variety of different hurricane visualizations: movies of …
Students view and explore a variety of different hurricane visualizations: movies of satellite imagery (visible and IR); composite images with rainfall intensity, wind circulation, temperature; cross sectional composites; radar imagery. Based upon their analysis of the images, they identify basic hurricanes structure, wind circulation patterns, precipitation patterns. Next, they compare their interpretation and labeling of the images with textbook or Internet derived diagrams of hurricane structure and refine their interpretation and labeling. To conclude, students are presented with images of a southern hemisphere tropical cyclone that they contrast and compare to northern hemisphere cyclones.
(Note: this resource was added to OER Commons as part of a batch upload of over 2,200 records. If you notice an issue with the quality of the metadata, please let us know by using the 'report' button and we will flag it for consideration.)
Students explore NOAA's official record of tropical storms and hurricanes, then work …
Students explore NOAA's official record of tropical storms and hurricanes, then work with the primary data and data products to identify the dates and aspects of the Atlantic hurricane season.
(Note: this resource was added to OER Commons as part of a batch upload of over 2,200 records. If you notice an issue with the quality of the metadata, please let us know by using the 'report' button and we will flag it for consideration.)
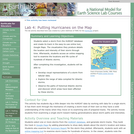
Students select a storm from the HURDAT database and create its track …
Students select a storm from the HURDAT database and create its track in the tool, Google Earth. The visualization they produce details the location and intensity of their storm through time. Afterwards, students access an online mapping tool to examine the locations and life cycles of hundreds of Atlantic storms.
(Note: this resource was added to OER Commons as part of a batch upload of over 2,200 records. If you notice an issue with the quality of the metadata, please let us know by using the 'report' button and we will flag it for consideration.)
No restrictions on your remixing, redistributing, or making derivative works. Give credit to the author, as required.
Your remixing, redistributing, or making derivatives works comes with some restrictions, including how it is shared.
Your redistributing comes with some restrictions. Do not remix or make derivative works.
Most restrictive license type. Prohibits most uses, sharing, and any changes.
Copyrighted materials, available under Fair Use and the TEACH Act for US-based educators, or other custom arrangements. Go to the resource provider to see their individual restrictions.