Conditional Remix & Share Permitted
CC BY-NC-SA
Interpreting A Graph - HS Algebra II
- Subject:
- Mathematics
- Material Type:
- Assessment
- Date Added:
- 07/18/2022
Interpreting A Graph - HS Algebra II
Exponential Functions Menu - HS Algebra II

Interpreting A Graph - HS Algebra II

This is a three-credit course which covers topics that enhance the students’ problem solving abilities, knowledge of the basic principles of probability/statistics, and guides students to master critical thinking/logic skills, geometric principles, personal finance skills. This course requires that students apply their knowledge to real-world problems. A TI-84 or comparable calculator is required. The course has four main units: Thinking Algebraically, Thinking Logically and Geometrically, Thinking Statistically, and Making Connections. This course is paired with a course in MyOpenMath which contains the instructor materials (including answer keys) and online homework system with immediate feedback. All course materials are licensed by CC-BY-SA unless otherwise noted.


Topics List for this Lesson: Sampling, Frequency Distributions, and GraphsMeasures of CenterMeasures of VarianceNormal Distributions and Problem SolvingZ-Scores and Unusual ValuesEmpirical Rule and Central Limit TheoremScatterplots, Correlation, and Regression


Rate
Type of Unit: Concept
Prior Knowledge
Students should be able to:
Solve problems involving all four operations with rational numbers.
Understand quantity as a number used with a unit of measurement.
Solve problems involving quantities such as distances, intervals of time, liquid volumes, masses of objects, and money, and with the units of measurement for these quantities.
Understand that a ratio is a comparison of two quantities.
Write ratios for problem situations.
Make and interpret tables, graphs, and diagrams.
Write and solve equations to represent problem situations.
Lesson Flow
In this unit, students will explore the concept of rate in a variety of contexts: beats per minute, unit prices, fuel efficiency of a car, population density, speed, and conversion factors. Students will write and refine their own definition for rate and then use it to recognize rates in different situations. Students will learn that every rate is paired with an inverse rate that is a measure of the same relationship. Students will figure out the logic of how units are used with rates. Then students will represent quantitative relationships involving rates, using tables, graphs, double number lines, and formulas, and they will see how to create one such representation when given another.

In this lesson, students represent quantitative relationships involving rates using tables, graphs, double number lines, and formulas. Students will understand how to create one such representation when given another representation.Key ConceptsQuantitative relationships involving rates can be represented using tables, graphs, double number lines, and formulas. One such representation can be used to create another representation. Two rates can describe each situation: the rate and its inverse. For the water pump situation, there are two related formulas: a formula for finding the quantity of water pumped for any amount of time, and a formula for finding the amount of time for any quantity of water.Goals and Learning ObjectivesUnderstand that tables, graphs, double number lines, and formulas can be used to represent the same situation.Compare the different representations within a situation and the same representation across similar situations.Understand each representation and how to find the rate in each one.

Ratios
Type of Unit: Concept
Prior Knowledge
Students should be able to:
Calculate with whole numbers up to 100 using all four operations.
Understand fraction notation and percents and translate among fractions, decimal numbers, and percents.
Interpret and use a number line.
Use tables to solve problems.
Use tape diagrams to solve problems.
Sketch and interpret graphs.
Write and interpret equations.
Lesson Flow
The first part of the unit begins with an exploration activity that focuses on a ratio as a way to compare the amount of egg and the amount of flour in a mixture. The context motivates a specific understanding of the use of, and need for, ratios as a way of making comparisons between quantities. Following this lesson, the usefulness of ratios in comparing quantities is developed in more detail, including a contrast to using subtraction to find differences. Students learn to interpret and express ratios as fractions, as decimal numbers, in a:b form, in words, and as data; they also learn to identify equivalent ratios.
The focus of the middle part of the unit is on the tools used to represent ratio relationships and on simplifying and comparing ratios. Students learn to use tape diagrams first, then double number lines, and finally ratio tables and graphs. As these tools are introduced, students use them in problem-solving contexts to solve ratio problems, including an investigation of glide ratios. Students are asked to make connections and distinctions among these forms of representation throughout these lessons. Students also choose a ratio project in this part of the unit (Lesson 8).
The third and last part of the unit covers understanding percents, including those greater than 100%.
Students have ample opportunities to check, deepen, and apply their understanding of ratios, including percents, with the selection of problems in the Gallery.

Students design and work on their projects in class. They review the project rubric and, as a class, add criteria relevant to their specific projects.Key ConceptsStudents apply their knowledge about ratios to solve a problem. They represent ratios using models such as tables, tape diagrams, double number lines, or graphs.Goals and Learning ObjectivesUse and interpret ratios to solve a problem.Model ratios—including tables, tape diagrams, double number lines, graphs—to represent a problem situation.Articulate strategies, thought processes, and approaches to solving a problem and defend why the solution is reasonable.

This lesson introduces the concept of a glide ratio and encourages students to use appropriate tools strategically (Mathematical Practice 5). Students use tape diagrams, double number lines, ratio tables, graphs, and equations to represent glide ratios.Key ConceptsA glide ratio for an object or an organism in flight is the ratio of forward distance to vertical distance (in the absence of power and wind). For a given object or organism that glides, this ratio has a constant value and is treated as a feature of the object or organism.Goals and Learning ObjectivesUnderstand the concept of a glide ratio.Make connections within and between different ways of representing ratios.

Students focus on interpreting, creating, and using ratio tables to solve problems. They also relate ratio tables to graphs as two ways of representing a relationship between quantities.Key ConceptsRatio tables and graphs are two ways of representing relationships between variable quantities. The values shown in a ratio table give possible pairs of values for the quantities represented and define ordered pairs of coordinates of points on the graph representing the relationship. The additive and multiplicative structure of each representation can be connected, as shown: Goals and Learning ObjectivesComplete ratio tables.Use ratio tables to compare ratios and solve problems.Plot values from a ratio table on a graph.Understand the connection between the structure of ratio tables and graphs.

Samples and ProbabilityType of Unit: ConceptualPrior KnowledgeStudents should be able to:Understand the concept of a ratio.Write ratios as percents.Describe data using measures of center.Display and interpret data in dot plots, histograms, and box plots.Lesson FlowStudents begin to think about probability by considering the relative likelihood of familiar events on the continuum between impossible and certain. Students begin to formalize this understanding of probability. They are introduced to the concept of probability as a measure of likelihood, and how to calculate probability of equally likely events using a ratio. The terms (impossible, certain, etc.) are given numerical values. Next, students compare expected results to actual results by calculating the probability of an event and conducting an experiment. Students explore the probability of outcomes that are not equally likely. They collect data to estimate the experimental probabilities. They use ratio and proportion to predict results for a large number of trials. Students learn about compound events. They use tree diagrams, tables, and systematic lists as tools to find the sample space. They determine the theoretical probability of first independent, and then dependent events. In Lesson 10 students identify a question to investigate for a unit project and submit a proposal. They then complete a Self Check. In Lesson 11, students review the results of the Self Check, solve a related problem, and take a Quiz.Students are introduced to the concept of sampling as a method of determining characteristics of a population. They consider how a sample can be random or biased, and think about methods for randomly sampling a population to ensure that it is representative. In Lesson 13, students collect and analyze data for their unit project. Students begin to apply their knowledge of statistics learned in sixth grade. They determine the typical class score from a sample of the population, and reason about the representativeness of the sample. Then, students begin to develop intuition about appropriate sample size by conducting an experiment. They compare different sample sizes, and decide whether increasing the sample size improves the results. In Lesson 16 and Lesson 17, students compare two data sets using any tools they wish. Students will be reminded of Mean Average Deviation (MAD), which will be a useful tool in this situation. Students complete another Self Check, review the results of their Self Check, and solve additional problems. The unit ends with three days for students to work on Gallery problems, possibly using one of the days to complete their project or get help on their project if needed, two days for students to present their unit projects to the class, and one day for the End of Unit Assessment.
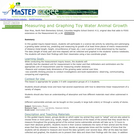
This activity is an guided inquiry based lesson where students measure and graph data on a two-coordinate graph the growth of a toy animal submerged in water over a period of time.

Modeling, Functions, and Graphs covers the content of a typical college algebra course with an emphasis on functions and modeling; when combined with a trigonometry text or supplement, this text can be used in a precalculus course.
The text employs a variety of applications to motivate mathematical thinking. Each chapter opens with a problem of historical or contemporary significance highlighting the material in the chapter, and includes by an Investigation that previews the skills to be introduced. These Investigations can be used in class as guided explorations or as projects for small groups. We have also provided a set of more challenging Projects at the end of each chapter.
Mathematics, as we all know, is the language of science, and fluency in algebraic skills has always been necessary for anyone aspiring to disciplines based on calculus. But in the information age, increasingly sophisticated mathematical methods are used in all fields of knowledge, from archaeology to zoology. Consequently, there is a new focus on the courses before calculus. The availability of calculators and computers allows students to tackle complex problems involving real data, but requires more attention to analysis and interpretation of results. All students, not just those headed for science and engineering, should develop a mathematical viewpoint, including critical thinking, problem-solving strategies, and estimation, in addition to computational skills. Modeling, Functions and Graphs employs a variety of applications to motivate mathematical thinking.
In this group task students collect data and analyze from the class to answer the question "is there an association between whether a student plays a sport and whether he or she plays a musical instrument? "
(Nota: Esta es una traducción de un recurso educativo abierto creado por el Departamento de Educación del Estado de Nueva York (NYSED) como parte del proyecto "EngageNY" en 2013. Aunque el recurso real fue traducido por personas, la siguiente descripción se tradujo del inglés original usando Google Translate para ayudar a los usuarios potenciales a decidir si se adapta a sus necesidades y puede contener errores gramaticales o lingüísticos. La descripción original en inglés también se proporciona a continuación.)
Este módulo de 10 días se basa en conceptos de grado 2 sobre datos, gráficos y parcelas de línea. Los dos temas en este módulo se centran en generar y analizar datos categóricos y de medición. Al final del módulo, los estudiantes están trabajando con una mezcla de gráficos de imágenes escalados, gráficos de barras y gráficos de línea para resolver problemas utilizando datos categóricos y de medición.
Encuentre el resto de los recursos matemáticos de Engageny en https://archive.org/details/engageny-mathematics.
English Description:
This 10-day module builds on Grade 2 concepts about data, graphing, and line plots. The two topics in this module focus on generating and analyzing categorical and measurement data. By the end of the module, students are working with a mixture of scaled picture graphs, bar graphs, and line plots to problem solve using both categorical and measurement data.
Find the rest of the EngageNY Mathematics resources at https://archive.org/details/engageny-mathematics.
(Nota: Esta es una traducción de un recurso educativo abierto creado por el Departamento de Educación del Estado de Nueva York (NYSED) como parte del proyecto "EngageNY" en 2013. Aunque el recurso real fue traducido por personas, la siguiente descripción se tradujo del inglés original usando Google Translate para ayudar a los usuarios potenciales a decidir si se adapta a sus necesidades y puede contener errores gramaticales o lingüísticos. La descripción original en inglés también se proporciona a continuación.)
En el módulo 4, los estudiantes extienden lo que ya saben sobre las tarifas unitarias y las relaciones proporcionales con ecuaciones lineales y sus gráficos. Los estudiantes entienden las conexiones entre relaciones proporcionales, líneas y ecuaciones lineales en este módulo. Los estudiantes aprenden a aplicar las habilidades que adquirieron en los grados 6 y 7, con respecto a la notación simbólica y las propiedades de la igualdad para transcribir y resolver ecuaciones en una variable y luego en dos variables.
Encuentre el resto de los recursos matemáticos de Engageny en https://archive.org/details/engageny-mathematics.
English Description:
In Module 4, students extend what they already know about unit rates and proportional relationships to linear equations and their graphs. Students understand the connections between proportional relationships, lines, and linear equations in this module. Students learn to apply the skills they acquired in Grades 6 and 7, with respect to symbolic notation and properties of equality to transcribe and solve equations in one variable and then in two variables.
Find the rest of the EngageNY Mathematics resources at https://archive.org/details/engageny-mathematics.