This lesson incorporates sea surface data collected by NASA satellites. Data for …
This lesson incorporates sea surface data collected by NASA satellites. Data for three surface characteristics- height, temperature and speed- are used for several activities. Students examine the differences in speed of currents relative to distance from the Equator. Sea surface data anomalies are charted and further analyzed. In addition, surface current data is presented to examine patterns related to El Niño. Note that this is lesson three of five on the Ocean Motion website. Each lesson investigates ocean surface circulation using satellite and model data and can be done independently. See Related URL's for links to the Ocean Motion Website that provide science background information, data resources, teacher material, student guides and a lesson matrix.
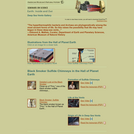
This online gallery of photos, illustrations, and videos provides a snapshot of …
This online gallery of photos, illustrations, and videos provides a snapshot of deep sea vents and the ancient forms of life that can be found within them. Transcripts of the videos are provided, and the photos and illustrations are accompanied by explanatory texts.
This activity is designed to introduce students to the way in which …
This activity is designed to introduce students to the way in which thermohaline circulation and the biological pump influence the distribution of nutrients, oxygen, carbon, and radiocarbon in the Atlantic vs. Pacific Oceans.
(Note: this resource was added to OER Commons as part of a batch upload of over 2,200 records. If you notice an issue with the quality of the metadata, please let us know by using the 'report' button and we will flag it for consideration.)
In this lab activity, students determine density differences of water samples with …
In this lab activity, students determine density differences of water samples with varying temperature and salinity levels. Students synthesize information to predict the effects of oil in given water samples.
These two hands-on labs are about the role of temperature and salinity …
These two hands-on labs are about the role of temperature and salinity in governing the density of seawater, a major factor controlling the ocean's vertical movements and layered circulation. In the first activity students work in groups to determine the density of tap water and of tap water with salt, then compare the densities. The second activity investigates the role of temperature and salinity in determining seawater density. Students use a Temperature-Salinity (T-S) Diagram to examine the effect of mixing on density. A list of key concepts, essential questions, common preconceptions and more is included. These are part of the Aquarius Hands-on Laboratory Activities.
This resource is a video abstract of a research paper created by …
This resource is a video abstract of a research paper created by Research Square on behalf of its authors. It provides a synopsis that's easy to understand, and can be used to introduce the topics it covers to students, researchers, and the general public. The video's transcript is also provided in full, with a portion provided below for preview:
"Oceanic microbiomes are critical to the global carbon cycle and to oceanic carbon and energy cycling, and the Deltaproteobacteria clade SAR324 is one of the few microbial groups inhabiting all oceanic depth zones. Although the metabolic potential of dark-zone SAR324 has been investigated, the ecology and metabolic traits of euphotic- and twilight-zone SAR324 remain unclear. To learn more, a recent study collected SAR324 from various depths of the North Pacific Subtropical Gyre. A pangenomic analysis including published genomic data revealed considerable intra-clade diversity, as indicated by the average nucleotide identity (ANI). The bacteria clustered into four ecotypes with different spatiotemporal distributions, and bacteria at different depths had different metabolic characteristics. The deep- and twilight-zone bacteria exhibited genomic and metabolic traits consistent with sulfur-based chemolithoautotrophy..."
The rest of the transcript, along with a link to the research itself, is available on the resource itself.
SYNOPSIS: In this lesson, students explore different methods of desalination. SCIENTIST NOTES: …
SYNOPSIS: In this lesson, students explore different methods of desalination.
SCIENTIST NOTES: This lesson teaches students about potable water scarcity and then explores desalination as a possible solution in water-stressed areas. Desalination technologies are introduced, and energy and environmental costs of desalination are discussed. A video resource explores a novel desalination technology, the Solar Dome, being built in Saudi Arabia. Students are tasked with designing and building their own solar still, and opportunity is given for design optimization. This lesson is recommended for teaching.
POSITIVES: -This lesson can be multidisciplinary and can be completed in engineering, computer science, digital art, English or science classes. -Students and teachers are given voice and multiple areas of choice in this lesson. -Students become agents of change in their own communities, identifying problems and solutions. -Students and teachers can make this conceptual, practical, or hands-on. -This lesson can be spread out over several days and be considered a mini-unit.
ADDITIONAL PREREQUISITES: -Students should be familiar with the basics of climate change. -Students should be familiar with the basic scientific concepts of osmosis. -Students should be familiar with basic engineering concepts like scaling and design.
DIFFERENTIATION: -Students can work independently or in a group with adjusted requirements. -Teachers can use subject and grade level vocabulary already being worked on or learned in class. Teachers can add vocabulary words in the glossary slide of the Teacher Slideshow. -To further develop practical science or engineering skills, students can work together to create and implement a workable desalination solution at the school, home, or community level. Students can lead a workshop for family, an environmental club, or the community. -Some students may wish to communicate their advocacy via social media. Make sure to follow all school rules and monitor students’ progress if you allow this in the classroom.
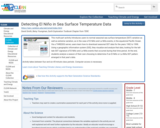
This multi-part activity introduces users to normal seasonal sea surface temperature (SST) …
This multi-part activity introduces users to normal seasonal sea surface temperature (SST) variation as well as extreme variation, as in the case of El NiÃo and La NiÃa events, in the equatorial Pacific Ocean. Via a THREDDS server, users learn how to download seasonal SST data for the years 1982 to 1998. Using a geographic information system (GIS), they visualize and analyze that data, looking for the tell-tale SST signature of El NiÃo and La NiÃa events that occurred during that time period. At the end, students analyze a season of their own choosing to determine if an El NiÃo or La NiÃa SST pattern emerged in that year's data.
In this problem-based learning (PBL) activity, students take on the role of …
In this problem-based learning (PBL) activity, students take on the role of a student research scientist and explore the role of solar energy in determining climate, focusing on the urban heat island effect. Students conduct research and compare temperatures between two cities, and determine the factors that are responsible for the difference exhibited between them. The lesson is supported by teacher notes, answer key, glossary and an appendix with information about using PBL in the classroom. This is the third of three activities in Investigating the Climate System: Energy, a Balancing Act, and serves as an authentic assessment for all three modules.
In this project, students perform library research on an assigned marine animal, …
In this project, students perform library research on an assigned marine animal, create a formatted poster of their topic, and share with their classmates what they've learned in a poster session, conducted in the way of poster sessions at science conferences. Afterward, students complete a written assignment where they are asked to reflect on their experience as a participant in a community of science students, their focused learning on their own marine animal, their larger learning about the diversity of marine life from their poster session participation, and what it implies about the intrinsic value of the ocean realm, and the need for conservation. The outcomes for this assignment are aligned with course-specific outcomes articulated in the Minnesota Transfer Curriculum. They are:
Synthesize central concepts from assigned readings of scientific literature in written assignments. Discuss/compare characteristics of diverse environments in the context of ocean science. Interpret data generated by oceanographic techniques, and present written and oral summaries of their findings. Explain the basic structure and function of the ocean realm, the impact of humans on it, and the impact of the ocean realm on humans.
(Note: this resource was added to OER Commons as part of a batch upload of over 2,200 records. If you notice an issue with the quality of the metadata, please let us know by using the 'report' button and we will flag it for consideration.)
This animation depicts real-time wind speed and direction at selected heights above …
This animation depicts real-time wind speed and direction at selected heights above Earth's surface, ocean surface currents, and ocean surface temperatures and anomalies.
This video segment adapted from NASA's Goddard Space Flight Center describes El …
This video segment adapted from NASA's Goddard Space Flight Center describes El Niño, how it forms, and the chain reaction of consequences it triggers around the globe.
This short video uses animated imagery from satellite remote sensing systems to …
This short video uses animated imagery from satellite remote sensing systems to illustrate that Earth is a complex, evolving body characterized by ceaseless change. Adapted from NASA, this visualization helps explain why understanding Earth as an integrated system of components and processes is essential to science education.
Hands-on laboratory activity that allows students to investigate the effects of distance …
Hands-on laboratory activity that allows students to investigate the effects of distance and angle on the input of solar radiation at Earth's surface, the role played by albedo, the heat capacity of land and water, and how these cause the seasons. Students predict radiative heating based on simple geometry and experiment to test their hypotheses.
Individual project designed to combine basic oceanographic concepts in the creation of …
Individual project designed to combine basic oceanographic concepts in the creation of a travel brochure. Involves some group interaction, but project is individual. Can be done online or in a face-to-face class. Best completed at midterm or later in the semester so that most concepts have been introduced.
LEARNING OUTCOMES
Describe major oceanic processes and evaluate their influence on the coastal environment. 2Use global data on climate and wind patterns to quantify and describe conditions at various specific coastal sites.
(Note: this resource was added to OER Commons as part of a batch upload of over 2,200 records. If you notice an issue with the quality of the metadata, please let us know by using the 'report' button and we will flag it for consideration.)
This video shows 15 years of data obtained via Polar-orbiting satellites that …
This video shows 15 years of data obtained via Polar-orbiting satellites that are able to detect subtle differences in ocean color, allowing scientists to see where there are higher concentrations of phytoplankton - a proxy for the concentration of chlorophyll in the ocean.
This National Geographic video explains the origins of the El NiÃo Southern …
This National Geographic video explains the origins of the El NiÃo Southern Oscillation using animations and shows the impacts on humans, wildlife and habitat, particularly in the United States.
This video explains what El NiÃo is and provides the definition of …
This video explains what El NiÃo is and provides the definition of El NiÃo. It goes into detail about the devastating terrestrial and aquatic effects an El NiÃo can have on living organisms and the climate (disease, storms, floods, tornadoes, drought, wildfire, increased air temperatures, decreased water temperatures, etc).
This short video illustrates the phenomena of El NiÃo and La NiÃa: …
This short video illustrates the phenomena of El NiÃo and La NiÃa: their relationships to tradewinds and surface water temperatures, and their effects on precipitation in North America.
No restrictions on your remixing, redistributing, or making derivative works. Give credit to the author, as required.
Your remixing, redistributing, or making derivatives works comes with some restrictions, including how it is shared.
Your redistributing comes with some restrictions. Do not remix or make derivative works.
Most restrictive license type. Prohibits most uses, sharing, and any changes.
Copyrighted materials, available under Fair Use and the TEACH Act for US-based educators, or other custom arrangements. Go to the resource provider to see their individual restrictions.