This is an interactive map that illustrates the scale of potential flooding …
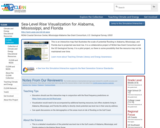
This is an interactive map that illustrates the scale of potential flooding in Alabama, Mississippi, and Florida due to projected sea level rise. It is a collaborative project of NOAA Sea Grant Consortium and the US Geological Survey. It is a pilot project, so there is some possibility that the resource may not be maintained over time.
This video features Dr. Gary Griggs, a scientist with the National Research …
This video features Dr. Gary Griggs, a scientist with the National Research Council, discussing predictions for sea-level rise on the West Coast states. The video includes effective visualizations and animations of the effects of plate tectonics and sea level rise on the West Coast.
Video and animations of sea level from NASA's Climate website. Since 1992, …
Video and animations of sea level from NASA's Climate website. Since 1992, NASA and CNES have studied sea surface topography as a proxy for ocean temperatures. NASA Missions TOPEX/Poseidon, Jason 1 and Jason 2 have been useful in predicting major climate, weather, and geologic events including El Nino, La Nina, Hurricane Katrina, and the Indian Ocean Tsunami.
This interactive map allows the user to explore projected alterations of land …
This interactive map allows the user to explore projected alterations of land surfaces in coastal communities, based on different scenarios of sea level changes over time.
This is a multi-step, interactive tool for users to identify potential risks …
This is a multi-step, interactive tool for users to identify potential risks (to people, buildings, infrastructure, contamination, land) for selected coastal areas in the US, using scenarios of water level rising (as a result of tides, sea level rise, and storm surge) from 0-10 feet. Tool provides local, regional and national resources as guidance for managing risk.
This resource is a collection of climate change-related graphs for teachers to …
This resource is a collection of climate change-related graphs for teachers to use in their classrooms, with links to the source articles and an explanation of how to guide students through reflecting on and learning from the graphs.
This is an interactive website that provides descriptive information and data related …
This is an interactive website that provides descriptive information and data related to ten key climate indicators. These climate indicators and related resources show global patterns and data that are intuitive and compelling teaching tools.
This activity allows students to demonstrate the thermal expansion of water for …
This activity allows students to demonstrate the thermal expansion of water for themselves using water bottles and straws. The discussion allows them to explore the connection between this concept and sea level rise due to climate change.
This is an interactive visualization that allows users to explore the scientific …
This is an interactive visualization that allows users to explore the scientific research being done on Thwaites glacier, one of the most important glaciers in Antarctica.
This narrated slideshow describes the impact of sea level rise on Tuvalu, …
This narrated slideshow describes the impact of sea level rise on Tuvalu, one of the low-lying island nations in the South Pacific. As the frequency and intensity of floods and cyclones increases, the island is shrinking and saltwater intrusion is affecting local food production on the plantations. As a result, many residents are moving off the island to New Zealand, where they face major cultural changes.
This module contains five activities, in increasing complexity, that focus on understanding …
This module contains five activities, in increasing complexity, that focus on understanding how to interpret and manipulate sea level data, using real data from NOAA. Students first need to understand how to access and interpret sea surface height and tide data. To understand how to interpret these data, students will review and practice computing mean values. Along the way, they will learn how different factors, such as storms, affect tide levels and how to measure them. The goal is for students to become experienced with these kinds of data and the tools for accessing them so that, by the end of the module, they can continue to explore data sets driven by their own inquiry.
In this activity, students examine a pair of satellite images of the …
In this activity, students examine a pair of satellite images of the ocean and determine whether there is a relationship between the height of ocean waves and the sea level. Data from the two images are plotted side by side and students discuss the reasons for their findings. The resource includes the images and a student worksheet. Summary background information, data and images supporting the activity are available on the Earth Update data site. To complete the activity, students will need to access the Space Update multimedia collection, which is available for download and purchase for use in the classroom.
This visualization is a series of three short animations/videos that illustrate how …
This visualization is a series of three short animations/videos that illustrate how the changing ice sheets result in sea level rise. It uses satellite data to show how Greenland and Antarctica are losing mass at a rate of 283 gigatons per year and 145 gigatons per year, respectively. Simulation shows visualization of one gigaton and how much this translates to sea level rise.
This demonstration will show how increased temperatures will hasten the melting of …
This demonstration will show how increased temperatures will hasten the melting of ice in the environment, contributing to a rise in sea level and subsequent flooding of coastal areas. Materials required include 2 aquariums, plastic wrap, a clamp light with a 60 watt bulb, modeling clay, ice, pebbles and rocks, and a ruler. Teacher background information, student worksheets and a scoring rubric are included. This is Activity 3 of the learning module, Too Many Blankets, part of the lesson series, The Potential Consequences of Climate Variability and Change.
This activity allows students to explore sea level rise. The experiment allows …
This activity allows students to explore sea level rise. The experiment allows them to test whether land ice and/or sea ice contribute to sea level rise as they melt.
This lesson guides students to connect the PBS Adaptation video series on …
This lesson guides students to connect the PBS Adaptation video series on climate adaptation to their own community. Students describe their community, identify climate impacts faced by their community, research how their community is adapting to those impacts, and then create a digital story about what they found.
No restrictions on your remixing, redistributing, or making derivative works. Give credit to the author, as required.
Your remixing, redistributing, or making derivatives works comes with some restrictions, including how it is shared.
Your redistributing comes with some restrictions. Do not remix or make derivative works.
Most restrictive license type. Prohibits most uses, sharing, and any changes.
Copyrighted materials, available under Fair Use and the TEACH Act for US-based educators, or other custom arrangements. Go to the resource provider to see their individual restrictions.