The subject introduces the principles of ocean surface waves and their interactions …
The subject introduces the principles of ocean surface waves and their interactions with ships, offshore platforms and advanced marine vehicles. Surface wave theory is developed for linear and nonlinear deterministic and random waves excited by the environment, ships, or floating structures. Following the development of the physics and mathematics of surface waves, several applications from the field of naval architecture and offshore engineering are addressed. They include the ship Kelvin wave pattern and wave resistance, the interaction of surface waves with floating bodies, the seakeeping of ships high-speed vessels and offshore platforms, the evaluation of the drift forces and other nonlinear wave effects responsible for the slow-drift responses of compliant offshore platforms and their mooring systems designed for hydrocarbon recovery from large water depths. This course was originally offered in Course 13 (Department of Ocean Engineering) as 13.022. In 2005, ocean engineering subjects became part of Course 2 (Department of Mechanical Engineering), and this course was renumbered 2.24.
This Summary for teachers is inspired by the IPCC's Special Report on …
This Summary for teachers is inspired by the IPCC's Special Report on the Ocean and Cryosphere in a Changing Climate. This resource is a teacher-friendly version of the Summary for Policymakers of the IPCC report. Useful infographics and ideas for short class activities are provided, as well a glossary and a list of educational resources.
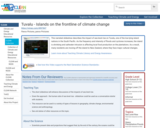
This narrated slideshow describes the impact of sea level rise on Tuvalu, …
This narrated slideshow describes the impact of sea level rise on Tuvalu, one of the low-lying island nations in the South Pacific. As the frequency and intensity of floods and cyclones increases, the island is shrinking and saltwater intrusion is affecting local food production on the plantations. As a result, many residents are moving off the island to New Zealand, where they face major cultural changes.
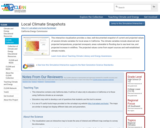
This interactive visualization provides a clear, well-documented snapshot of current and projected …
This interactive visualization provides a clear, well-documented snapshot of current and projected values of several climate variables for local areas in California. The climate variables include observed and projected temperatures, projected snowpack, areas vulnerable to flooding due to sea level rise, and projected increase in wildfires. The projected values come from expert sources and well-established climate models.
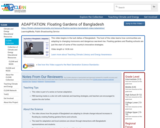
This video begins in the lush deltas of Bangladesh. The host of …
This video begins in the lush deltas of Bangladesh. The host of the video learns how communities are adapting to changing monsoons and dangerous sea-level rise. Floating gardens and floating schools are just the start of some of the country's innovative strategies.
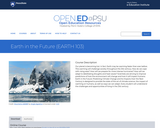
Our planet is becoming hot. In fact, Earth may be warming faster …
Our planet is becoming hot. In fact, Earth may be warming faster than ever before. This warming will challenge society throughout the 21st century. How do we cope with rising seas? How will we prepare for more intense hurricanes? How will we adapt to debilitating droughts and heat waves? Scientists are striving to improve predictions of how the environment will change and how it will impact humans. Earth in the Future: Predicting Climate Change and Its Impacts Over the Next Century is designed to provide the state of the art of climate science, the impact of warming on humans, as well as ways we can adapt. Every student will understand the challenges and opportunities of living in the 21st century.
This resource is a collection of climate change-related graphs for teachers to …
This resource is a collection of climate change-related graphs for teachers to use in their classrooms, with links to the source articles and an explanation of how to guide students through reflecting on and learning from the graphs.
Bell Telephone Science Hour produced this video in 1958, explaining how the …
Bell Telephone Science Hour produced this video in 1958, explaining how the production of CO2 from factories and automobiles is causing the atmosphere to warm, melting the polar ice caps, and causing the sea level to rise.
This 3-activity sequence addresses the question: "To what extent should coastal communities …
This 3-activity sequence addresses the question: "To what extent should coastal communities build or rebuild?" The activity uses social science and geoscience data to prepare an evidence-based response to the question, in targeted US coastal communities.
This role-playing activity allows students to learn more about the six general …
This role-playing activity allows students to learn more about the six general ways Americans respond to climate change and engage in conversations while embodying these groups. Students will be able to describe the different ways Americans respond to climate change and develop arguments to support their claims.
The activity follows a progression that examines the CO2 content of various …
The activity follows a progression that examines the CO2 content of various gases, explores the changes in the atmospheric levels of CO2 from 1958 to 2000 from the Mauna Loa Keeling curve, and the relationship between CO2 and temperature over the past 160,000 years. This provides a foundation for examining individuals' input of CO2 to the atmosphere and how to reduce it.
This video highlights the Pentagon's focus on climate change as the military …
This video highlights the Pentagon's focus on climate change as the military examines potential risks, strategic responses, and impacts of climate change on future military and humanitarian missions. In 2010, for the first time, the Pentagon focused on climate change as a significant factor in its Quadrennial Defense Review of potential risks and strategic responses. Rear Admiral David Titley, Oceanographer of the Navy, explains why the US military sees clear evidence of climate change and how those changes will affect future military and humanitarian missions.
Our planet is becoming hot. In fact, Earth may be warming faster …
Our planet is becoming hot. In fact, Earth may be warming faster than ever before. This warming will challenge society throughout the 21st century. How do we cope with rising seas? How will we prepare for more intense hurricanes? How will we adapt to debilitating droughts and heat waves? Scientists are striving to improve predictions of how the environment will change and how it will impact humans. Earth in the Future: Predicting Climate Change and Its Impacts Over the Next Century is designed to provide the state of the art of climate science, the impact of warming on humans, as well as ways we can adapt. Every student will understand the challenges and opportunities of living in the 21st century.
Warming oceans and melting landlocked ice caused by global climate change may …
Warming oceans and melting landlocked ice caused by global climate change may result in rising sea levels. This rise in sea level combined with increased intensity and frequency of storms will produce storm surges that flood subways, highways, homes, and more. In this activity, visitors design and test adaptations to prepare for flooding caused by sea level rise.
The Office for Climate Education (OCE) launches an innovative online course: an …
The Office for Climate Education (OCE) launches an innovative online course: an opportunity for teachers all over the world to learn how to teach about climate change online and for free.
In this optional activity, students analyze maps of wind patterns from three …
In this optional activity, students analyze maps of wind patterns from three levels in the atmosphere in order to infer global atmospheric circulation patterns and their role in balancing the radiation budget they established in Units 4 and 5. The main activity is a jigsaw in which students explore a single map on their own prior to class, confer with their classmates in specialty groups, and then synthesize atmospheric circulation for an assigned latitudinal zone. In these synthesis groups, students create maps and cross-section concept sketches to use in a full class discussion at the end of class. A follow-up assignment asks students to infer the relationship between global atmospheric circulation patterns and precipitation and then predict possible consequences of changes in these patterns due to global warming.
(Note: this resource was added to OER Commons as part of a batch upload of over 2,200 records. If you notice an issue with the quality of the metadata, please let us know by using the 'report' button and we will flag it for consideration.)
An introductory environmental science project tasking students with comparing offshore oil and …
An introductory environmental science project tasking students with comparing offshore oil and wind power development.
(Note: this resource was added to OER Commons as part of a batch upload of over 2,200 records. If you notice an issue with the quality of the metadata, please let us know by using the 'report' button and we will flag it for consideration.)
Maps displaying global environmental data (specifically Solar Energy and Average Temperature) through …
Maps displaying global environmental data (specifically Solar Energy and Average Temperature) through the course of a year are compared in order to understand how the Earth works as a system focusing on Polar Regions. Students then explore data from schools located in Alaska and Antarctica to understand processes that drive the temperature patterns; students then visit the National Snow and Ice Data Center Web site to learn more about the Cryosphere (focusing on Albedo and Sea Ice); finally students visit NOAA's web site looking at data of Sea Ice data anomalies. (Link to the relevant pages in these web sites are listed below.)
(Note: this resource was added to OER Commons as part of a batch upload of over 2,200 records. If you notice an issue with the quality of the metadata, please let us know by using the 'report' button and we will flag it for consideration.)
No restrictions on your remixing, redistributing, or making derivative works. Give credit to the author, as required.
Your remixing, redistributing, or making derivatives works comes with some restrictions, including how it is shared.
Your redistributing comes with some restrictions. Do not remix or make derivative works.
Most restrictive license type. Prohibits most uses, sharing, and any changes.
Copyrighted materials, available under Fair Use and the TEACH Act for US-based educators, or other custom arrangements. Go to the resource provider to see their individual restrictions.