A great variety of processes affect the surface of the Earth. Topics …
A great variety of processes affect the surface of the Earth. Topics to be covered are production and movement of surficial materials; soils and soil erosion; precipitation; streams and lakes; groundwater flow; glaciers and their deposits. The course combines aspects of geology, climatology, hydrology, and soil science to present a coherent introduction to the surface of the Earth, with emphasis on both fundamental concepts and practical applications, as a basis for understanding and intelligent management of the Earth’s physical and chemical environment.
The learning objectives for this GIS exercise are to 1) understand rainfall …
The learning objectives for this GIS exercise are to 1) understand rainfall spatial variability and how to account for it when making areal-rainfall estimates, and 2) learn how ArcGIS can be used as a tool to determine areal averages, and 3) compare the advantages and drawbacks of the various techniques.
(Note: this resource was added to OER Commons as part of a batch upload of over 2,200 records. If you notice an issue with the quality of the metadata, please let us know by using the 'report' button and we will flag it for consideration.)
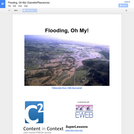
On July 4th, 1997, Mars Pathfinder landed at the mouth of Ares …
On July 4th, 1997, Mars Pathfinder landed at the mouth of Ares Vallis, a large channel that drains into the Chryse Planitia basin. While there remains a great deal to debate about the origin of the channels, one of the leading hypotheses at present is the idea that these features are the result of catastrophic flooding. If this is correct, then the plains where Pathfinder landed may be rich in debris eroded out of the Martian highlands across which the Ares Vallis channel passes, providing a golden combination -- a relatively safe landing site which still provides access to a wide variety of different rock types. [If you would like to learn more about the many Pathfinder results, explore the April, 1999 and January, 2000 issues of the journal Journal of Geophysical Research -- Planets (the green one) in the library.]
For the sake of this lab assignment you will hypothesize that the Ares Vallis and associated deposits were indeed produced by catastrophic flooding, and will use the information at your disposal to learn all you can about the putative flooding event.
(Note: this resource was added to OER Commons as part of a batch upload of over 2,200 records. If you notice an issue with the quality of the metadata, please let us know by using the 'report' button and we will flag it for consideration.)
Students make measurements of dam dimensions and water levels above and below …
Students make measurements of dam dimensions and water levels above and below a small, accessible earthen dam. They assess the soil texture in the field. They follow up by developing a simple flow net and estimating seepage rate as part of a problem set. They discuss their assumptions and the likely sources and magnitude of error.
(Note: this resource was added to OER Commons as part of a batch upload of over 2,200 records. If you notice an issue with the quality of the metadata, please let us know by using the 'report' button and we will flag it for consideration.)
Students will be given the task to build a dam that will …
Students will be given the task to build a dam that will stand against water. Students will design and build a scaled model of a dam and test the model for the ability to reduce the impact of a flood. Students will build a scaled model dam and test the dam's effectiveness in preventing flood waters. Students will evaluate the efficacy of the dam they constructed and built. Students will contemplate what actions can be taken and materials that could be used in order to create a more effective dam in the future. This unit was created as part of the ALEX Interdisciplinary Resource Development Summit.
This module introduces students to the fundamental principles and uses of electrical …
This module introduces students to the fundamental principles and uses of electrical resistivity, with a focus on an environmental application. Students explore the characteristics and environmental setting of Harrier Meadow, a saltmarsh just outside of New York City. They investigate the relationship between electrical resistivity and physical properties of the soil in the marsh. Students also discover how variations in survey configuration parameters control investigation depth (how far into the ground the signals sense) and spatial resolution (what size objects can be detected). Finally, students learn about and then perform geophysical inversion, which is the process of estimating the geophysical properties of the subsurface from geophysical observations. In the final unit of the module, students evaluate the extent to which the geophysical dataset and direct physical measurements support the hypothesis, introduced in Unit 1, accounting for the distribution of Pickleweed in Harrier Meadow. This module is intended to require approximately 2-3 weeks of class time. Teaching material includes PowerPoints that may be used in lectures or provided for self-guided learning, exercises, and handouts that ask students to synthesize what they learn from the exercises. In addition, multiple choice and short answer questions can be given to students as homework, on quizzes, or on exams.
(Note: this resource was added to OER Commons as part of a batch upload of over 2,200 records. If you notice an issue with the quality of the metadata, please let us know by using the 'report' button and we will flag it for consideration.)
This assignment is best presented in two lab periods to represent the …
This assignment is best presented in two lab periods to represent the "before" and "after" scenarios of land use and their impact on hydrology. It requires documentation in map and/or airphoto form of land use in a specific watershed at two times: historical and modern. Historical USGS topographic maps from the 19th century were used in this case, along with digital orthophotos for the modern-day scenario. Some means of quantifying subareas within the watershed is also needed, either using software (ArcGIS) or transparent overlays and boxcounting from a translucent grid would work. For each of the sets of documentation: historical and modern, the students follow the USDA-NRCS TR55 empirical procedure to estimate event runoff depths and peak estimated discharge from the watershed. An area-weighted curve number (CN) is calculated based on tabulated categories of land use. Some judgment is involved in adapting the tabulated land use categories to the specific watershed used, and selecting an appropriate statistical average rainfall event to use. The sum of Darcy's Law calculations of discharge along streamtubes to a surface stream or estuary provides a groundwater discharge value over time for comparison. Each of these parts of the activity provides opportunities for the instructor to discuss uncertainties and sources of error. Note that although software allowing TR-55 analysis exists, it is simpler and more instructive to have students use the paper method and forms in the manual.
(Note: this resource was added to OER Commons as part of a batch upload of over 2,200 records. If you notice an issue with the quality of the metadata, please let us know by using the 'report' button and we will flag it for consideration.)
Students observe the process of evaporation, make comparisons about the process, then …
Students observe the process of evaporation, make comparisons about the process, then construct a diagram and use it to describe the process of evaporation.
In Massachusetts, Manchester-by-the-Sea's wastewater treatment plant is located right on the coast. …
In Massachusetts, Manchester-by-the-Sea's wastewater treatment plant is located right on the coast. The town's water utility is working with the EPA's Climate Ready Water Utilities program to consider its adaptation options.
During this module students use multiple experiences (reading, video, the outdoors, a …
During this module students use multiple experiences (reading, video, the outdoors, a survey of their water footprints, writing, and lots of discussion) to examine how life today, in comparison to pre-industrial times, makes our connections to water virtually invisible. Students use the class's water footprint results to find out how agricultural and industrial water uses link us to people distant in both place and time. They weigh the consequences of these invisible connections in creating the lost sense of dependence and responsibility that typifies unsustainability. Students study the variability of water footprints within our class to help identify more sustainable personal choices. They consider the activity of a local watershed association to educate and involve people in improving the quality of local streams as a model of how community action can accomplish what individuals cannot.
(Note: this resource was added to OER Commons as part of a batch upload of over 2,200 records. If you notice an issue with the quality of the metadata, please let us know by using the 'report' button and we will flag it for consideration.)
In this activity students use published data from the Massachusetts Military Reservation …
In this activity students use published data from the Massachusetts Military Reservation to observe and predict mass transport parameters.
(Note: this resource was added to OER Commons as part of a batch upload of over 2,200 records. If you notice an issue with the quality of the metadata, please let us know by using the 'report' button and we will flag it for consideration.)
Students further their understanding of the salmon life cycle and the human …
Students further their understanding of the salmon life cycle and the human structures and actions that aid in the migration of fish around hydroelectric dams by playing an animated PowerPoint game involving a fish that must climb a fish ladder to get over a dam. They first brainstorm their own ideas, and then learn about existing ways engineers have made dams "friendlier" to migrating fish, before being quizzed as part of the game.
Students learn how to use and graph real-world stream gage data to …
Students learn how to use and graph real-world stream gage data to create event and annual hydrographs and calculate flood frequency statistics. Using an Excel spreadsheet of real-world event, annual and peak streamflow data, they manipulate the data (converting units, sorting, ranking, plotting), solve problems using equations, and calculate return periods and probabilities. Prompted by worksheet questions, they analyze the runoff data as engineers would. Students learn how hydrographs help engineers make decisions and recommendations to community stakeholders concerning water resources and flooding.
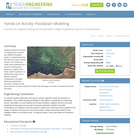
This Lecture Tutorial worksheet guides students through thinking about the effects humans …
This Lecture Tutorial worksheet guides students through thinking about the effects humans have on infiltration, and how that effects the duration and severity of floods. It is designed to be used in groups after a brief lecture introducing surface and ground water flow into a stream.
(Note: this resource was added to OER Commons as part of a batch upload of over 2,200 records. If you notice an issue with the quality of the metadata, please let us know by using the 'report' button and we will flag it for consideration.)
SSAC Geology of National Parks module/Geology of National Parks course. Students calculate …
SSAC Geology of National Parks module/Geology of National Parks course. Students calculate probabilities using USGS hydrograph data, a spreadsheet of daily stage heights, and the COUNTIF function.
(Note: this resource was added to OER Commons as part of a batch upload of over 2,200 records. If you notice an issue with the quality of the metadata, please let us know by using the 'report' button and we will flag it for consideration.)
Mark C. Rains (University of South Florida), David C. Shelley (National Parks Service) and Len Vacher (University of South Florida)
Cover page by Len Vacher, University of South Florida
This is a 21 day unit on the topic of floods. Students …
This is a 21 day unit on the topic of floods. Students will plan and prepare for what might happen in the event of a flood in our area. We have had floods in the past that have affected the Walterville School, its campus, and the surrounding areas. Using this as a springboard, students will discuss the effects of flooding, do research and interview family members who have experienced flooding, and then discuss possible ways to prevent significant damage on the buildings and surrounding areas. They will then design a barrier that could protect an area from damage for a period of time. Students will need materials to conduct experiments. We have listed these in the lesson plan. We have also included a trip to the Leaburg Dam so that students can learn about dams and their uses. We plan on teaching this unit in the fall.
In this activity, students use a National Weather Service flood forecast, USGS …
In this activity, students use a National Weather Service flood forecast, USGS gauging data, and other reports to estimate the maximum storm discharge from the New River and Wolf Creek, two streams in the Southeast U.S. which experienced flooding in November 2003. Topographic and urban maps are used to predict where flooding would occur and to evaluate strategies for reducing flood risk for the residents of the region.
Students explore the impact of changing river volumes and different floodplain terrain …
Students explore the impact of changing river volumes and different floodplain terrain in experimental trials with table top-sized riverbed models. The models are made using modeling clay in aluminum baking pans placed on a slight incline. Water added "upstream" at different flow rates and to different riverbed configurations simulates different potential flood conditions. Students study flood dynamics as they modify the riverbed with blockages or levees to simulate real-world scenarios.
In this lab, students measure a topographic and geologic cross-section across a …
In this lab, students measure a topographic and geologic cross-section across a floodplain by simple surveying and auguring techniques.
(Note: this resource was added to OER Commons as part of a batch upload of over 2,200 records. If you notice an issue with the quality of the metadata, please let us know by using the 'report' button and we will flag it for consideration.)
No restrictions on your remixing, redistributing, or making derivative works. Give credit to the author, as required.
Your remixing, redistributing, or making derivatives works comes with some restrictions, including how it is shared.
Your redistributing comes with some restrictions. Do not remix or make derivative works.
Most restrictive license type. Prohibits most uses, sharing, and any changes.
Copyrighted materials, available under Fair Use and the TEACH Act for US-based educators, or other custom arrangements. Go to the resource provider to see their individual restrictions.