This activity helps students understand how mixtures are formed. They will make …
This activity helps students understand how mixtures are formed. They will make predictions regarding the rate of mixing. Students should report that the variation of heated water and crushed sugar creates the shortest mixing time.
This lesson plan helps students understand the factors that affect water quality …
This lesson plan helps students understand the factors that affect water quality and the conditions that allow for different animals and plants to survive. Students will look at the effects of water quality on various water-related activities and describe water as an environmental, economic and social resource. The students will also learn how engineers use water quality information to make decisions about stream modifications.
The purpose of this investigation is to facilitate understanding of the basics …
The purpose of this investigation is to facilitate understanding of the basics of cloud formation involving the changing state of water. This activity should enhance the understanding of the change of state concept, which is important in the study of meteorology.
Students explore materials engineering by modifying the material properties of water. Specifically, …
Students explore materials engineering by modifying the material properties of water. Specifically, they use salt to lower the freezing point of water and test it by making ice cream. Using either a simple thermometer or a mechatronic temperature sensor, students learn about the lower temperature limit at which liquid water can exist such that even if placed in contact with a material much colder than 0 degrees Celsius, liquid water does not get colder than 0 °C. This provides students with an example of how materials can be modified (engineered) to change their equilibrium properties. They observe that when mixed with salt, liquid water's lower temperature limit can be dropped. Using salt-ice mixtures to cool the ice cream mixes to temperatures lower than 0 °C works better than ice alone.
This video segment adapted from NOVA describes the emergence of life on …
This video segment adapted from NOVA describes the emergence of life on the islands of Hawaii from a barren volcanic platform under the ocean waves to the rich explosion of life that covers the many climate zones of the islands today.
In this video segment adapted from NOVA, dramatic footage of avalanches and …
In this video segment adapted from NOVA, dramatic footage of avalanches and animations of ice crystals illustrate how a layer of weakly-bonded snow can contribute to a devastating avalanche.
This demonstration shows that an increase in temperature will speed up the …
This demonstration shows that an increase in temperature will speed up the water cycle. One outcome will be an increase in rainfall. A second outcome will be the increase in total evaporation of water and subsequent drought. Materials required include two aquariums, plastic wrap, 2 clamp lamps with 60 watt light bulbs, pebbles and rocks, modeling clay, blue food coloring, and water. Student worksheets, background information for teachers, and a scoring rubric are included. This is Activity 2 in Too Many Blankets, a module in the lesson series, Potential Consequences of Climate Variability and Change.
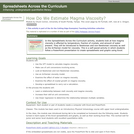
SSAC Physical Volcanology module. Students build a spreadsheet to examine how magma …
SSAC Physical Volcanology module. Students build a spreadsheet to examine how magma viscosity varies with temperature, fraction of crystals, and water content using the non-Arrhenian VFT model.
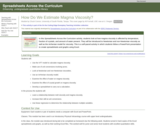
SSAC Physical Volcanology module. Students build a spreadsheet to examine how magma …
SSAC Physical Volcanology module. Students build a spreadsheet to examine how magma viscosity varies with temperature, fraction of crystals, and water content using the non-Arrhenian VFT model.
(Note: this resource was added to OER Commons as part of a batch upload of over 2,200 records. If you notice an issue with the quality of the metadata, please let us know by using the 'report' button and we will flag it for consideration.)
From this original story, young readers and listeners learn about four tools …
From this original story, young readers and listeners learn about four tools scientists use to study climate - climate stations, weather balloons, satellites, and buoys. The story is available at two reading levels and in three formats - text-only, illustrated booklet, and electronic book. Glossary included. Each issue of Beyond Weather and the Water Cycle contains an original story that expands on the theme.
Students investigate how sea levels might rise when ice sheets and ice …
Students investigate how sea levels might rise when ice sheets and ice caps melt. By constructing a pair of models, students can observe the effects of ice melt in two different situations.
This activity is a hands-on modeling of the effects of pollution on …
This activity is a hands-on modeling of the effects of pollution on our ground and surface water. Students will observe and record their observations as pollution is placed on the ground in their model and it is rained upon.
In this lesson, the students will learn that plants need water, air, …
In this lesson, the students will learn that plants need water, air, nutrients, and sunlight to grow. This lesson results from a collaboration between the Alabama State Department of Education and ASTA. **This lesson can be taught over a three to five day period. Simply repeat the steps as the students will become more knowledgeable of the target.
Students measure the permeability of different types of soils, compare results and …
Students measure the permeability of different types of soils, compare results and realize the importance of size, voids and density in permeability response.
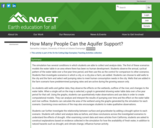
Students learn about porosity and permeability and relate these concepts to groundwater …
Students learn about porosity and permeability and relate these concepts to groundwater flow. They use simple materials to conduct a porosity experiment and use the data to understand how environmental engineers decide on the placement and treatment of a drinking water well.
In this lesson, students will conduct an experiment to compare similarities and …
In this lesson, students will conduct an experiment to compare similarities and differences with wind and water erosion. Students will create a narrative story describing a particular rock formation based on evidence in the rock patterns, including an estimated time frame, plants and animals that may have been living in the environment, and the type of erosion that formed their rock formation. This lesson results from a collaboration between the Alabama State Department of Education and ASTA.
In this lesson and its associated activity, students conduct a simple test …
In this lesson and its associated activity, students conduct a simple test to determine how many drops of each of three liquids can be placed on a penny before spilling over. The three liquids are water, rubbing alcohol, and vegetable oil; because of their different surface tensions, more water can be piled on top of a penny than either of the other two liquids. However, this is not the main point of the activity. Instead, students are asked to come up with an explanation for their observations about the different amounts of liquids a penny can hold. In other words, they are asked to make hypotheses that explain their observations, and because middle school students are not likely to have prior knowledge of the property of surface tension, their hypotheses are not likely to include this idea. Then they are asked to come up with ways to test their hypotheses, although they do not need to actually test their hypotheses. The important points for students to realize are that 1) the tests they devise must fit their hypotheses, and 2) the hypotheses they come up with must be testable in order to be useful.
The simulation has several conditions in which students are able to collect …
The simulation has several conditions in which students are able to collect and analyze data. The first of these scenarios models the water table in an area where there has been no human development. Students observe the annual, cyclical pattern of the water table over a five-year time period, and then use this as the control for comparison to other scenarios. Students then investigate scenarios in which a city, or a city plus a farm, are added. Students can choose to add wells to the city and the farm and select well pumping rates to meet human consumption needs in the city. Wells that are added in the farm scenario have predetermined pumping rates and are active during the growing season only.
As students add wells and gather data, they observe the effects on the wetlands, outflow of the river, and changes to the water table. When a single cell on the map is selected, a graph is generated showing water table data over a five year period for that cell. Using the graphs, students can quantitatively make observations and use data in order to create computational models. They can analyze and interpret the results of pumping over time and the effect on the water table and river outflow. Students can calculate the area of the wetland using the graphs generated by the simulation for each scenario. Examining cross-sections of the map also encourages students to make qualitative observations.
Students can further investigate the relationship between surface and groundwater by adding a drought option to each scenario. Students will collect and analyze data as before, and draw conclusions across the investigated scenarios to understand the effects of drought. After examining current data and news articles from California, students are asked to construct explanations based on evidence collected in the simulation for how the availability of fresh water, in addition to natural hazards such as drought, and climate change, influence human activity.
(Note: this resource was added to OER Commons as part of a batch upload of over 2,200 records. If you notice an issue with the quality of the metadata, please let us know by using the 'report' button and we will flag it for consideration.)
This formative assessment item uncovers students' ideas about the conservation of water …
This formative assessment item uncovers students' ideas about the conservation of water and the water cycle. The probe is aligned with the National Science Education Standards and can be used before, during, or after instruction. Resources are provided as well as instructional strategies.
No restrictions on your remixing, redistributing, or making derivative works. Give credit to the author, as required.
Your remixing, redistributing, or making derivatives works comes with some restrictions, including how it is shared.
Your redistributing comes with some restrictions. Do not remix or make derivative works.
Most restrictive license type. Prohibits most uses, sharing, and any changes.
Copyrighted materials, available under Fair Use and the TEACH Act for US-based educators, or other custom arrangements. Go to the resource provider to see their individual restrictions.