SYNOPSIS: In this lesson, students calculate their own carbon footprint using Peter …
SYNOPSIS: In this lesson, students calculate their own carbon footprint using Peter Kalmus's methodology in his book Being the Change: Live Well and Spark a Climate Revolution.
SCIENTIST NOTES: This lesson shows basic techniques to calculate individual carbon footprint. There are no contradictions in the data source or methods for calculating carbon footprint as indicated in this lesson. All the examples shown are valid estimations. This lesson has passed our science review and is suitable for classroom.
POSITIVES: -This lesson features many math skills: addition, subtraction, multiplication, and division by rational numbers; estimation; conversion between metric and imperial units; and logic and reasoning skills. -Students manipulate data in a spreadsheet and create a pie chart using many different data points. -Students engage with many different units, including CO2e, CCF, kWh, and therms. -This lesson provides students with the opportunity to measure their own impact on the Earth. Students can reflect on their own impact and brainstorm ways to live a more sustainable lifestyle.
ADDITIONAL PREREQUISITES: -You must be sensitive to your students if you choose to run this lesson. Be mindful of socioeconomic status in your classroom. -Students will most likely ask their families for certain data points, like electricity or fossil gas usage. Be sensitive to your students' families. Some families may not want to share this information with their child's teacher. -In most situations, it would be useful for students to have the option to share final numbers with the class. You do not have to make it mandatory. -This lesson was adapted from "Leaving Fossil Fuel" Chapter 9 from Peter Kalmus's book Being the Change: Live Well and Spark a Climate Revolution.
DIFFERENTIATION: -This lesson can be used as an extension, extra credit opportunity, or one option in a menu of choices. -If everyone feels comfortable, students can collaborate as they figure out their respective carbon footprints. -Students should use the glossary at the end of the Teacher Slideshow to help them understand new terms and concepts. -Students can use the 2nd and 3rd tabs in their spreadsheets to see finished examples. This is author Dan Castrigano's carbon footprint data from 2019-2020.
In this lesson, students calculate their own carbon footprint using Peter Kalmus's …
In this lesson, students calculate their own carbon footprint using Peter Kalmus's methodology in his book Being the Change: Live Well and Spark a Climate Revolution.
Step 1 - Inquire: Students watch a short video on the climate crisis. Students engage in a brief discussion on the prompt "Do my individual actions matter?"
Step 2 - Investigate: Students calculate their own carbon footprints.
Step 3 - Inspire: Students engage in a discussion, reflecting on this activity and the importance of individual actions.
SYNOPSIS: This lesson shows that different foods have different environmental impacts. Students …
SYNOPSIS: This lesson shows that different foods have different environmental impacts. Students will calculate ratios and practice proportional thinking.
SCIENTIST NOTES: This lesson is thoroughly sourced. It is engaging and suitable for students to understand how to measure carbon footprint from food sources. The activities in the lesson would also enable them to build their quantitative skills to determine the extent of CO2 impact on the environment. The lesson has passed our science review, and it is advised for classroom use.
POSITIVES: -This lesson is great because it shows that different foods have different environmental impacts. -It shows the great disparity between certain types of foods. For example, creating 1 kg of beef (from a beef herd) emits 99.48 kgCO2eq. Creating 1 kg of potatoes creates only 0.46 kgCO2eq. Raising beef creates more than 200x the carbon dioxide than raising the same amount of potatoes!
ADDITIONAL PREREQUISITES: -You will need to share the Student Slideshow with students and grant them editing rights. They will all be writing in the same slideshow. -In general, animals and animal products use far more resources than plants. -Kilograms are used in this lesson. Some students will be unfamiliar with this unit. You can read more about the kilogram at Britannica. An easy conversion from kilograms to pounds is 1 kg = 2.2 lbs. -Kilograms of CO2 equivalent are also used in this lesson. This is pretty abstract for the students. You can have them imagine holding a 2.2-pound ball in their hands. This ball has mass and takes up space. This is the "pollution" generated when creating different foods.
DIFFERENTIATION: -You can create groups of students with mixed abilities. -If a group finishes early, you can ask these extension questions: -"Food 1’s emissions are what % of food 2’s emissions?" -"Can you convert your answers from kilograms to pounds?" -The Investigate section features a completed table of calculations. You can use this before the students begin their calculations. You can also share this with certain students or groups and let other groups complete their calculations on their own. Another option is to have students use the completed table to check their thinking when they are finished. There is a walkthrough of calculations in the speaker notes of this slide.
SYNOPSIS: This lesson is about the distribution and density of trees in …
SYNOPSIS: This lesson is about the distribution and density of trees in urban areas and how that relates to environmental justice.
SCIENTIST NOTES: This lesson uses data from peer-reviewed research that breaks down the forest cover in cities as it correlates to income. The evidence is clear and convincing that more affluent neighborhoods have more tree cover, which has a documented benefit on the residents. All external links are scientifically sound, and this lesson has pass our science quality assessment.
POSITIVES: -This is an engaging lesson because it is so personal. Students will think about tree cover where they live and how that relates to demographic data. -Students will practice their data analysis skills.
ADDITIONAL PREREQUISITES: -It is necessary to share the Student Slideshow with your students and give them editing access before beginning the lesson. All students will be writing in the same slideshow. -The videos list the benefits of trees pretty quickly. It might be hard for students to type fast enough to keep up. You could play the videos at 0.9 speed or replay parts of the videos as necessary. -The following is a list of benefits of trees. Students will create a similar list while they are watching the two videos outlining the benefits of trees.
-Reduce nearby outside temperatures -Reduce amount of energy used for heating and cooling buildings -Absorb carbon dioxide, thus mitigating climate change -Filter urban pollutants and fine particulates -Provide habitat, food, and protection to plants and animals -Provide food for people -Increase biodiversity -Provide wood that can be used at the end of a tree’s life -Improve physical and mental health of people -Increase property values -Create oxygen -Provide shade for people and animals -Control stormwater runoff, protecting water quality and reducing the need for water treatment -Protect against mudslides -Help prevent floods -Improve air quality -Increase attention spans and decrease stress levels in people -Improve health outcomes in hospital patients
DIFFERENTIATION: -Teachers can use the glossary at the end of the slideshow at any point throughout the lesson to help students understand vocabulary.
-The spreadsheet and the graph on slide 11 might be tricky. Encourage your students to turn and talk to one another for help.
-Many students will not have a good understanding of Celsius. Easy reminder: Multiply the temperature in Celsius by 1.8 to get degrees Fahrenheit. Example: 2.5°C x 1.8 = 4.5°F (The temperature difference between poorest and richest census blocks in Milwaukee, Wisconsin.)
SYNOPSIS: In this lesson, students explore how climate change is impacting public …
SYNOPSIS: In this lesson, students explore how climate change is impacting public health in New Jersey, understand the difference between climate mitigation and climate adaptation, and create a video advocating for a climate adaptation strategy related to public health in New Jersey.
SCIENTIST NOTES: This lesson challenges students to consider the impacts of climate change on public health. The video defines public health in simple terms and how it affects and will affect students’ lives. Students are then encouraged to discuss how some of the quotes from the video make them feel and to investigate how climate change is linked to public health and justice. The differences between climate mitigation and climate adaptation are outlined, and sources are provided for further investigation. The lesson also includes links to credible sources to help students with their investigation. Students are encouraged to use their creative thinking skills to create a short video about climate adaptation strategies that could benefit New Jersey. This is a good lesson to challenge students' critical thinking and creative skills.
POSITIVES: -Students collaborate with their peers to create short videos as the assessment in this lesson. -Students get voice and choice as they select a climate adaptation strategy that matters the most to them. -If you teach multiple classes, you may be able to share the videos from all of your classes with all of your students.
ADDITIONAL PREREQUISITES: -Students should have access to the Teacher Slideshow on their own devices in order to explore example climate adaptation strategies, access links, and conduct research. -There may be student confusion when explaining the difference between climate mitigation and climate adaptation. Students may need more guidance as they choose their climate adaptation strategy. For example, students may gravitate toward "more renewable energy" or "more electric cars." Both of these are examples of climate mitigation strategies. Guide them toward climate adaptation strategies instead. -Some students may select climate adaptation strategies that are not directly related to public health. This may include building sea walls or planting more drought-resistant crops. These are climate adaptation strategies, but they are not directly related to public health. -Students can use the examples of how climate change impacts public health in New Jersey on the Teacher Slideshow to brainstorm ideas when choosing a climate adaptation strategy.
DIFFERENTIATION: -It may be best to group students of mixed ability. Conducting research for their videos might be the trickiest part of the lesson, and students with strong research skills and media literacy may be able to guide their groups. -Students can take turns being the videographer for their group. -You may require all students to have speaking roles in their videos. One student may also be the designated videographer for the group. -You can have students write scripts for their videos before recording. Other groups, however, may simply want to record their videos over and over again until they get a good take. -Students can record their videos on school-approved devices like laptops, iPads, or iPods. If these devices are not available, it may be necessary to have students use their personal devices.
SYNOPSIS: This lesson is an exploration of climate change data, including greenhouse …
SYNOPSIS: This lesson is an exploration of climate change data, including greenhouse gases, global temperature, ice melt, and sea level rise.
SCIENTIST NOTES: This lesson lets students explore almost real-time data on the ways human-caused global warming is disrupting different earth systems. All of the external links use the highest quality data available and are considered reputable sources. This lesson has passed our science quality assessment.
POSITIVES: -This lesson is all about curiosity and exploration. Students make meaning from all of this data collectively. This should be a very social activity as students share noticings, wonderings, and realizations with each other. -This can be a very hands-off lesson, as students guide their own learning and discussion.
ADDITIONAL PREREQUISITES: -You must copy the Student Slideshow, share it with your students, and grant them editing rights. They will be writing in the slideshow during the lesson. -The data from these sources is always being updated. -There are other greenhouse gases that students will not explore. These are the fluorinated gases, "a family of man-made gases used in a range of industrial applications." (Source: EU Commission)
DIFFERENTIATION: -Seeing the extent of these numbers might cause feelings of anxiety, sadness, anger, despair, or surprise in some students. Make sure to remind them that those feelings are normal and natural. Sharing those feelings with the class usually helps students feel better. Encourage students to share their honest reactions. -This exploration and these discussions might naturally lead into the “What can we do about it?” discussion. -These graphs are all unsustainable. It might be useful to use these graphs to better explain the concept of sustainability to the students. -Students should feel free to conduct research on their own to better understand their resources. For example, students can research sources of atmospheric nitrous oxide. -It is a good thing if students have more questions leaving this class than when they entered.
SYNOPSIS: In this lesson, students conduct research on electric bicycles and electric …
SYNOPSIS: In this lesson, students conduct research on electric bicycles and electric cars, choose one of these technologies, and create a video promoting its use as a climate solution.
SCIENTIST NOTES: Over the course of their use, electric cars are far more environmentally friendly than conventional automobiles. This lesson examines those benefits as well as how to make cities friendlier to bikes and other commuting options. The external resources in this lesson have passed our scientific review process.
POSITIVES: -Students must use hard data to promote either electric bicycles or electric cars. -Students record quick, informative videos as their assessment in this lesson plan.
ADDITIONAL PREREQUISITES: -Students should have a basic understanding of climate change. They should know that burning fossil fuels creates greenhouse gases and that greenhouse gases are heating up the planet. -There are fourteen total images in the Inquire section. Feel free to disregard some of them based on your needs. -Many students assume that electric cars do not create emissions at all. Students will learn: -There are embedded emissions from the manufacturing of electric cars. -Electric cars that use electricity generated by fossil fuels (coal, oil, and gas) are still creating emissions. -Your students will need access to devices to record their advertisements. Students can record themselves on iPods, iPads, laptops, or other school devices. Depending on your school's phone policy, you can have your students use their own devices.
DIFFERENTIATION: -Be sensitive to the socioeconomic situation of your students. Some students' families may not own bicycles or cars or be able to afford electric bicycles or electric cars. -Creating the advertisement can be done as a homework assignment. -Students may want to include drawings, puppets, props, or other creative items in their advertisements. Encourage their creative expression!
SYNOPSIS: This lesson plan connects intergenerational justice with the federal budget. SCIENTIST …
SYNOPSIS: This lesson plan connects intergenerational justice with the federal budget.
SCIENTIST NOTES: This lesson asks students to analyze how the U.S. federal government splits its budget amongst all of the federal agencies. The website used to track the spending is routinely updated. This lesson has passed the scientist quality assessment.
POSITIVES: -This is a powerful lesson connecting past, present, and future. -Students can have agency as to which group they'd like to represent: the present or the future.
ADDITIONAL PREREQUISITES: -The top 40 of 102 agencies by spending are included in the spreadsheet. The total (estimated) spending by all 40 of these agencies is $2,960,050,000,000. -The numbers presented at usaspending.gov are pretty messy. The attached spreadsheet rounds to cleaner numbers. -The numbers in red are rounded to the nearest billion. -The numbers in orange are rounded to the nearest hundred million. -The numbers in blue are rounded to the nearest fifty million. -Students may be missing some background knowledge. Be prepared to answer questions and/or do some research along with them. -For example, some students might not know the function of the Department of the Interior. -Feel free to use this site to look up the function of the major federal agencies. These are one-sentence explanations. -Feel free to also use this site from the White House where the major agencies (e.g., Agriculture, Defense) are outlined in one large paragraph. -Note that one “agency” is simply called “unreported data.” That data is not made public. Students can simply leave that $8 billion alone.
DIFFERENTIATION: -Students will most likely not finish. This is not really a “finishable” activity. The main goal of this activity is for students to figure out the best way to allocate money to the major federal agencies. -It is not really worth it to discuss the really small expenditures like the Administrative Conference of the U.S. -Students can wear armbands or robes to show that they are representing the future. Some physical representation of their role is a very powerful reminder of who they represent.
SYNOPSIS: In this lesson, students learn about greenwashing, watch a series of …
SYNOPSIS: In this lesson, students learn about greenwashing, watch a series of videos, and write a paragraph arguing if an advertisement is greenwashing or not.
SCIENTIST NOTES: This lesson introduces the concept of greenwashing and ways students can spot greenwashing by companies. The videos and accompanying materials embedded in the lesson are suitable to explain this concept. This lesson has passed our review process, and it is recommended for classroom use.
POSITIVES: -This lesson teaches students to critically examine digital media. As digital citizens, they must be aware of how to tell fact from fiction. -Students get voice and choice in this lesson. Students select their own videos and are able to argue if it is greenwashing or not.
ADDITIONAL PREREQUISITES: -Students will most likely argue that all the videos are examples of greenwashing. -Encourage students to dig around the corporation’s website to see if the claims are actually true. -Encourage students to scroll to the bottom of the corporations' websites. Students can usually find a site map, including pages like "sustainability." -Students can use the "More Resources on Greenwashing" slide to help them understand greenwashing.
DIFFERENTIATION: -In their paragraphs, weaker students can focus on music, the tone of the narrator’s voice, or imagery in the videos.
-You can push stronger students to include more concrete evidence in their paragraphs. -Most students will benefit from color coding their sentences. Encourage them to keep their text highlighted as they write. They can even keep their paragraphs color coded after they finish. -Weaker students may write only five sentences. Stronger students may write more sentences by adding context to their supporting evidence sentences. -If students are struggling with their closing sentences, ask them to read their claim sentences aloud. Sometimes this helps guide their thinking. -Stronger students who finish early can edit one another's paragraphs for mechanical errors, read their paragraphs out loud to one another, or discuss their chosen videos and greenwashing in general. -Students may be interested in reading a series of fact sheets on greenwashing in the aviation industry, like this one on electric flight.
SYNOPSIS: In this lesson, students explore an interactive map, learn about Cancer …
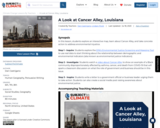
SYNOPSIS: In this lesson, students explore an interactive map, learn about Cancer Alley, and take concrete action to address environmental injustice.
SCIENTIST NOTES: This lesson introduces students to environmental justice and asks them to use an EPA mapping tool that shows how polluted an area is. The lesson also includes a video resource from Vox that highlights the area of Louisiana known as “Cancer Alley." To be as perfectly clear as possible, vast amounts of data and evidence show that people of color are disproportionately affected by pollution in the United States, and that higher exposure to pollutants directly correlates to higher incidence of disease. This video was produced in May of 2020, which is quite early on in the pandemic, and as such, some of the numbers presented in it are outdated. This outdated data is only for the numbers given when speaking on COVID-19 mortality rates. For example, the video says that Louisiana’s population is 32% Black (still correct) but Black people account for 56% of COVID-19 deaths. This is no longer the case as of July 2022, and according to data obtained from Louisiana’s government website, Black citizens account for 34% of deaths. While this is still disproportional, it is not as large of a disparity as when the video was produced. The same is true for Michigan, where Black residents now account for 17.5% of deaths but make up 14% of the population (data from michigan.gov). So, while this lesson highlights the importance of environmental justice and is overall scientifically sound, please just take note of the changes in the COVID-19 data.
POSITIVES: -This lesson clearly connects redlining and environmental racism. -This lesson shows a concrete example of the effects of systemic racism in the United States. ADDITIONAL PREREQUISITES:Some students may never have discussed racism and climate change before. Meet your students where they are and encourage them to ask good questions. -When teaching this sequence, it’s important to acknowledge the historical facts that have led to this injustice. Here are some resources to help you: -Dr. Ibram X. Kendi defines racist policy as “any measure that produces or sustains racial inequity between racial groups.” (Source: Article from Penguin Publishing Company) -Government entities suppressed the Black vote through different means until the Voting Rights Act in 1965. (Source: history.com) -Redlining was outlawed by the Fair Housing Act in 1968. (Source: ThoughtCo)
DIFFERENTIATION: -It may be necessary to offer the letter-writing as an extension or an extra credit opportunity. -Be sensitive to the needs of your students, as systemic racism affects them in different ways.
SYNOPSIS: In this lesson, students explore increased precipitation and sea level rise …
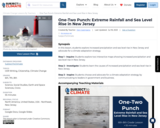
SYNOPSIS: In this lesson, students explore increased precipitation and sea level rise in New Jersey and advocate for a climate adaptation strategy.
SCIENTIST NOTES: In this lesson, students will learn the basics of sea level rise and extreme rainfall and how that specifically is impacting New Jersey. They will also be introduced to a variety of ideas and technology to combat the increased flooding due to these things. Finally, they will be inspired to take action and propose an idea that will benefit their local community. All the videos have been reviewed for accuracy. The two mapping tools also explain where they are getting their data from. This resource is recommended for teaching.
POSITIVES: -This lesson can be used in English, social studies, or science classes. -Students are given voice and choice in this lesson. -Students become agents of change in their own communities.
ADDITIONAL PREREQUISITES: -Students should be familiar with the basics of climate change and sea level rise. -Students will be advocating for climate adaptation strategies. Climate adaptation strategies are ways humans are adapting to a changing climate. This is different from climate mitigation, which are ways humans are slowing down climate change. Climate mitigation strategies include reducing fossil fuel use and ending deforestation. -The first two videos in the Investigate section will autoplay only the segment of the video that pertains to this lesson. -How Climate Change Has Intensified Hurricane Season will play from 02:59-03:36. -Thermal Expansion & Sea Level Rise will play from 01:27-02:54. -The Investigate section features six different resources. These resources (four videos, one map, and one podcast) should not take that much time individually.
DIFFERENTIATION: -Students' communication can be as simple or as thorough as you desire. They will need more time to research and craft their communication if you want their writing to be more fact-based and robust. -Some students may wish to communicate their advocacy via social media. Make sure to follow all school rules and monitor students' progress if you allow this in the classroom. -Allow students to pursue other methods of communication, adaptation strategies, and recipients not listed in the chart in the Inspire section. -In certain situations, it may be best to allow students to teach their family and friends about increased precipitation and sea level rise. This could be used as a replacement activity instead of student communication to government and business leaders.
SYNOPSIS: In this lesson, students will analyze Amanda Gorman's poem "Earthrise" and …
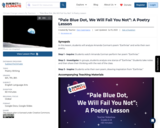
SYNOPSIS: In this lesson, students will analyze Amanda Gorman's poem "Earthrise" and write their own poetry.
SCIENTIST NOTES: The lesson introduces students to basic literary techniques and how to use poetry skills to communicate climate change and solutions to a diverse audience. There is no science to verify, but the resources, accompanying materials, and links in the lesson are credible and ideal for teaching. This lesson has passed our review.
POSITIVES: -Amanda Gorman is a brilliant poet. -Students will engage in lively group discussions. This poem is abundant in deep meaning and rhyme.
ADDITIONAL PREREQUISITES: -Before class, share the following with your students: -Student Slideshow. All students need editing rights, as they will be writing in the same slideshow. -Full Text of the Poem "Earthrise." Students will need viewing rights. -Student Document. Each student needs their own copy, as they will be writing their own poem on this document. -Amanda Gorman is most famous for performing "The Hill We Climb" at Joe Biden’s presidential inauguration on January 20, 2021. -Amanda Gorman delivered a TED talk called "Using Your Voice is a Political Choice."
DIFFERENTIATION: -You can select students of all abilities to read part of the poem after you have watched the video. -The six stanzas selected for group discussion are of various lengths. They range from 6 lines to 19 lines. You can assign weaker students to the shorter stanzas. -You can create groups of mixed abilities. -Students who like to take notes can be scribes in their groups. -Students may be unfamiliar with some of the vocabulary in “Earthrise.” -Students should use the two linked dictionaries on the resources slide to find definitions of unfamiliar words.
SYNOPSIS: This lesson plan connects redlining with current issues of environmental and …
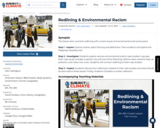
SYNOPSIS: This lesson plan connects redlining with current issues of environmental and racial justice.
SCIENTIST NOTES: This is a thoroughly sourced and cited lesson plan. All of the external links meet our quality standards for accuracy and current information. Additionally, the external links are well-sourced, and the data is provided for tools like the Tree Cover Equity map. This lesson has passed our scientific quality assessment.
Positives -This environmental racism lesson plan clearly connects redlining in the 1930s and environmental injustice today. -This lesson is extremely powerful because students make the connection between redlined areas and their case studies. It is nuanced and will not always line up perfectly. Overwhelmingly, however, neighborhoods that were redlined are experiencing environmental injustice - higher rates of asthma, unbearable heat, air pollution, and less tree cover. It is an incredibly meaningful "aha moment" for the students.
ADDITIONAL PREREQUISITES: -There might be some pushback with those who do not understand racism. -Students might think “I’m not racist.” But it’s important to know that racism exists whether one perpetrates individual racist acts or not. -For some background information and definitions, use this resource from Dr. Ibram X. Kendi’s book, How to Be an Antiracist. -It may be useful to discuss how climate change is a “threat multiplier.” For things like urban heat islands and urban tree cover, climate change makes inequities even worse.
DIFFERENTIATION: -It may be best to group students of different abilities when they are exploring their case studies. -If you live in the United States you can adapt case study #4 - the American Forests Tree Equity Score Map - to whichever major city is closest to your school. The lesson is designed for students to explore Philadelphia, but students can simply look at any other city to make the connection between redlining and urban tree cover.
SYNOPSIS: In this lesson, students learn how redlining connects to tree equity …
SYNOPSIS: In this lesson, students learn how redlining connects to tree equity and racial justice.
SCIENTIST NOTES: This lesson introduces the concepts of redlining, tree equity, and environmental racism to students. It walks students through the history of these practices and how the effects of these policies are still seen today. The links all provide detailed information about where their data is from and have been reviewed for accuracy. This resource is recommended for teaching.
POSITIVES: -This lesson provides a clear story between redlining in the 1930s and environmental injustice seen today. -This lesson shows students a tangible effect of systemic racism. -Students are given voice and choice in this lesson. -Students are empowered to think about solutions to environmental injustice.
ADDITIONAL PREREQUISITES: -Students should have some basic understanding that racism exists whether one perpetrates individual racist acts or not. -Students should have some basic understanding that systems or policies can be racist.
DIFFERENTIATION: -Extension activities can have students explore other forms of environmental injustice stemming from redlining. Examples include health issues, air pollution, urban heat, industrial pollution, water quality, etc. -Student groups can pair up to compare and contrast different regions in New Jersey. -Students can research policies or movements in addressing redlining in New Jersey. -Students can research the relationship between redlining and voter suppression.
SYNOPSIS: This lesson features a comparison of different travel options from New …
SYNOPSIS: This lesson features a comparison of different travel options from New York City to six other cities. Students compare walking, biking, driving, taking the bus, riding the train, and flying. Students conduct research and calculate the CO2e for each travel option.
SCIENTIST NOTES: The lesson explores emissions from the transportation system. Students would be able to learn how the society can decarbonize the transportation sector and compute the cost, time, and emissions from different transportation modes. There are no misconceptions in the data source and additional links. Thus, this lesson has passed our scientist review and is recommended for classroom use.
POSITIVES: -This is a fun, imaginative, engaging lesson. -This lesson features many math skills: addition, subtraction, multiplication, and division by rational numbers; estimation; logic and reasoning skills; problem-solving skills; and algebraic thinking.
ADDITIONAL PREREQUISITES: -You will need to share the Student Slideshow with students and grant them editing rights before the lesson. Students will be writing in the Student Slideshow. -Transportation is the largest sector of greenhouse gas emissions in the United States. We must decarbonize our transportation systems immediately to avoid the worst effects of climate change. -Students use equations derived from Peter Kalmus’s book called Being the Change: Live Well and Spark a Climate Revolution. -The Ford F-150 is used as the example vehicle because it is the best-selling vehicle in the United States. The unit CO2e is used for all travel options. CO2e is used because traveling by plane creates non-CO2 warming effects. You can read more about aviation’s non-CO2 warming effects at the Stay Grounded Website. So in order to best compare the pollution from these travel options, we must use the unit CO2e. -CO2e is a metric measure used to compare the emissions from various greenhouse gases on the basis of their global warming potential (GWP), by converting amounts of other gases to the equivalent amount of carbon dioxide with the same global warming potential. -There may not be an easy travel option for each route, so students might have to problem-solve. -The "How is it viewed by society?" column in the data chart is meant for students to discuss society’s views of that method of transportation. Do people think it is crazy? Normal? Only for the rich? Is one method considered only for "poor people"? Is one considered trendy or cool? Is it comfortable to travel in that way? Is it easy or difficult? These are all good prompts to ask students. -Encourage students to have an open mind when discussing low-carbon travel options, such as riding the bus or train. Some students may have never traveled long-distance by bus or train. These are low-carbon options that are significantly better for the planet than driving or flying.
DIFFERENTIATION: -Students can use the provided glossary to better understand vocabulary. -Students can answer the extension questions if they finish early. -Students can help other groups complete their charts if they finish early. -Students can check over other students’ answers if they finish early.
This lesson features a comparison of different travel options from New York …
This lesson features a comparison of different travel options from New York City to six other cities. Students compare walking, biking, driving, taking the bus, riding the train, and flying. Students conduct research and calculate the CO2e for each travel option.
Step 1 - Inquire: Students watch a short video on the climate crisis. In groups, students explore and discuss emissions from the transportation sector.
Step 2 - Investigate: Students are assigned one route between New York City and another city in the Northeast. Students calculate miles, cost, time, and CO2e for each travel option for their route.
Step 3 - Inspire: Students participate in a group discussion about the results and explore different ways to decarbonize our transportation system.
SYNOPSIS: This lesson introduces African environmentalist Wangari Maathai and links deforestation with …
SYNOPSIS: This lesson introduces African environmentalist Wangari Maathai and links deforestation with the concepts of governance, poverty, and income opportunities for women in Kenya.
SCIENTIST NOTES: This lesson introduces students to the Nobel Peace Prize-winning Wangari Maathai and deforestation. The Global Forest Watch resource is continually updated. This lesson has passed the science quality assessment.
POSITIVES: -Learning Wangari Maathai’s story is empowering for students because it emphasizes the fact that nobody is too small to make a difference. Maathai grew up in poverty in rural Kenya. Now she is remembered as one of the most powerful voices for environmental conservation, proper governance, and peace. -This lesson can inspire students to take direct action, just like Wangari Maathai. -This lesson is excellent for teaching the interdependence of environmental conservation, proper governance, poverty, income opportunities, and women's rights. -Global Forest Watch is an incredible resource. It has beautiful, detailed data. Students may want to continue exploring on their own time. ADDITIONAL PREREQUISITES:Wangari Maathai (1940-2011) was an environmental and political activist and the first African woman to win the Nobel Peace Prize. -In 1977, she founded the Green Belt Movement, an environmental organization focused on planting trees and promoting gender equality.
DIFFERENTIATION: -Making the connection between deforestation and other topics (governance, poverty, income opportunities, and women’s rights) might be difficult for some concrete thinkers. -You could frame these topics using the UN’s Sustainable Development Goals. -Goal 1: No Poverty -Goal 5: Gender Equality -Goal 8: Decent Work and Economic Growth -Goal 15: Peace, Justice, and Strong Institutions
SYNOPSIS: In this lesson, students learn about climate change, choose one solution …
SYNOPSIS: In this lesson, students learn about climate change, choose one solution to climate change, and write a claim-evidence-reasoning paragraph explaining why they believe it is the best solution to climate change.
SCIENTIST NOTES: Although there is no silver bullet to addressing climate change, combining multiple solutions and prioritizing the best ones are important strategies to combat present and future climate risk. This lesson introduces students to explore the best solutions to address climate change. Data in the resources, accompanying materials, and videos are accurate. Accordingly, this lesson has passed our science review.
POSITIVES: -This lesson is terrific for teaching paragraph structure. -The color coding of the sentences in the paragraph is really helpful, especially for concrete thinkers.
ADDITIONAL PREREQUISITES: -Project Drawdown is an excellent organization that quantifies solutions to climate change. This is great background reading before the lesson. If you sort the solutions by scenario 1 (2°C temperature rise by 2100, then reduced food waste is the #1 solution. If you sort the solutions by scenario 2 (1.5°C temperature rise by 2100), then onshore wind turbines are the #1 solution. These two solutions (food waste and renewable energy) are two of the four solutions presented in this lesson. -Encourage the students to use as many hard facts as possible in their supporting sentences. These include dates, names, places, and specific events. -You can use 2-3 videos of solutions to climate change if you do not want to use all of them. -This lesson can be paired with the StC Lesson Plan What's the Worst Impact of Climate Change?
DIFFERENTIATION: -Most students will benefit from color coding their sentences. Encourage them to keep their text highlighted as they write. They can even keep their paragraphs highlighted after they finish. -Weaker students may write only five sentences. Stronger students may expand more in their supporting sentences. -If students are struggling with their closing sentences, ask them to read their claim sentences aloud. Sometimes this helps guide their thinking. -Stronger students who finish early can read their paragraphs to one another, discuss the writing process, and discuss the climate crisis.
SYNOPSIS: In this lesson, students learn about climate change, choose one impact …
SYNOPSIS: In this lesson, students learn about climate change, choose one impact of climate change, and write a claim-evidence-reasoning paragraph explaining why they believe it is the worst impact of climate change.
SCIENTIST NOTES: Understanding the key drivers of climate change and weather extremes, including the carbon cycle and processes and changes in the earth-atmosphere-ocean systems, have been discussed in this lesson. This is important for students to learn and prepare for future climate risk. This lesson has passed our science review process.
POSITIVES: -This lesson is terrific for teaching paragraph structure. -The color coding of the sentences in the paragraph is really helpful, especially for concrete thinkers.
ADDITIONAL PREREQUISITES: -This lesson shows some of the impacts of climate change. Some of these might be difficult to hear. Students may feel anger, sadness, anxiety, or grief after hearing about some of these devastating impacts. Encourage them to share their emotions. -This lesson will naturally lead into the discussion of solutions to the climate crisis. Lean into that discussion. -There is, of course, no right answer to "What's the worst impact of climate change?" These impacts of climate change are all catastrophic in their own right. -Encourage the students to use as many hard facts as possible in their supporting sentences. These include dates, names, places, and specific events. -You can use 2-3 videos of impacts of climate change if you do not want to use all of them. -This lesson can be paired with the StC Lesson Plan What's the Best Solution to Climate Change? DIFFERENTIATION: -Most students will benefit from color coding their sentences. Encourage them to keep their text highlighted as they write. They can even keep their paragraphs highlighted after they finish. -Weaker students may write only five sentences. Stronger students may expand more in their supporting sentences. -If students are struggling with their closing sentences, ask them to read their claim sentences aloud. Sometimes this helps guide their thinking. -Stronger students who finish early can read their paragraphs to one another, discuss the writing process, and discuss the climate crisis.
SYNOPSIS: In this lesson, students learn about climate change, choose one impact …
SYNOPSIS: In this lesson, students learn about climate change, choose one impact of climate change affecting New Jersey, and write a claim-evidence-reasoning paragraph explaining why they believe it is the worst impact of climate change in New Jersey.
SCIENTIST NOTES: This lesson illustrates the impacts of climate change in New Jersey. Five video resources are presented that provide background information, answer skepticism, and explore four key implications of climate change in New Jersey. The four climate impact videos are well-sourced and address local concerns with scientists from Rutgers and the New Jersey Department of Environmental Protection. Students are tasked with deciding which is the worst impact of climate change and then writing a paragraph to support their claim. This lesson is recommended for teaching.
POSITIVES: -This lesson is terrific for teaching paragraph structure. -The color coding of the sentences in the paragraph is really helpful, especially for concrete thinkers.
ADDITIONAL PREREQUISITES: -This lesson shows some of the impacts of climate change. Some of these might be difficult to hear. Students may feel anger, sadness, anxiety, or grief after hearing about some of these devastating impacts. Encourage them to share their emotions. -There is, of course, no right answer to “What’s the worst impact of climate change?” These impacts of climate change are all catastrophic in their own right. -Encourage the students to use as many hard facts as possible in their supporting sentences. These include dates, names, places, and specific events. -You can use 2-3 videos of impacts of climate change if you do not want to use all of them. -Make sure students know that there are many other impacts of climate change aside from the four impacts in the four videos. Other impacts of climate change include extreme weather events, mass extinction, climate migration, etc. The goal of this lesson is to choose one of those four impacts of climate change.
DIFFERENTIATION: -Most students will benefit from color coding their sentences. Encourage them to keep their text highlighted as they write. They can even keep their paragraphs highlighted after they finish. -Weaker students may write only five sentences. Stronger students may expand more in their supporting sentences. -If students are struggling with their closing sentences, ask them to read their claim sentences aloud. Sometimes this helps guide their thinking. -Stronger students who finish early can read their paragraphs to one another, discuss the writing process, and discuss possible solutions to climate change.
No restrictions on your remixing, redistributing, or making derivative works. Give credit to the author, as required.
Your remixing, redistributing, or making derivatives works comes with some restrictions, including how it is shared.
Your redistributing comes with some restrictions. Do not remix or make derivative works.
Most restrictive license type. Prohibits most uses, sharing, and any changes.
Copyrighted materials, available under Fair Use and the TEACH Act for US-based educators, or other custom arrangements. Go to the resource provider to see their individual restrictions.