In this activity, students will explore the concept of binary fission, generation …
In this activity, students will explore the concept of binary fission, generation time, and bacterial growth curves, with an emphasis on the log phase. Students will use semi-log graphs and linear graphs to plot bacterial cell growth.
Hi. This OER contains PowerPoint Presentation slides for the Microbiology OpenStax textbook. …
Hi. This OER contains PowerPoint Presentation slides for the Microbiology OpenStax textbook. Chapters 1 - 10 have been uploaded to this platform. All PowerPoint presentations will be refined during implementation. In the meantime, please feel free to use these resources and modify to your liking as I have a different arrangement of slides that are most suitable to my student's needs and course learning outcomes. Thank you for taking time to stop by! "OpenStax Microbiology Slides" by Adronisha Frazier, Louisiana Community and Technical College System, Northshore Technical Community College is licensed under CC BY-SA 4.0.
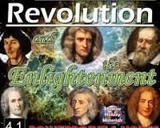
This is an activity for students to learn more about persons that …
This is an activity for students to learn more about persons that were involved in the Scientific Revolution and the Enlightenment period. This activity will give students a chance to learn more about the people of this period and the paticular thoughts they came up with.
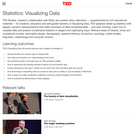
TED Studies, created in collaboration with Wiley, are curated video collections …
TED Studies, created in collaboration with Wiley, are curated video collections supplemented by rich educational materials for students, educators and self-guided learners. In Visualizing Data, TED speakers shake up statistics with elegant, dynamic representations that make mountains of data comprehensible and even exciting. Learn how to visualize data and present complicated statistics in elegant and captivating ways. Relevant areas of interest, study and coursework include: information design, demography, statistical literacy, economics, sociology, media studies, linguistics, meteorology and computer science.
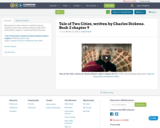
My project is a video resource created for anyone looking to better …
My project is a video resource created for anyone looking to better their understanding of, Tale of Two Cities, Book 2 chapter 9, written by Charles Dickens,
No restrictions on your remixing, redistributing, or making derivative works. Give credit to the author, as required.
Your remixing, redistributing, or making derivatives works comes with some restrictions, including how it is shared.
Your redistributing comes with some restrictions. Do not remix or make derivative works.
Most restrictive license type. Prohibits most uses, sharing, and any changes.
Copyrighted materials, available under Fair Use and the TEACH Act for US-based educators, or other custom arrangements. Go to the resource provider to see their individual restrictions.


![Graphing bacterial growth rates: semi-log graphs v linear graphs [version 1.0]](https://img.oercommons.org/160x134/oercommons/media/screenshots/e8764e3493c56ce8d4e94383740b081291952698653d949aaefccbdfd517221d.png)