Updating search results...

Search Resources

6 Results

View
Selected filters:
Confidence Intervals
Conditional Remix & Share Permitted
CC BY-NC-SA
Rating
0.0 stars

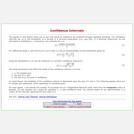
The applets in this section of Statistical Java allow you to see how levels of confidence are achieved through repeated sampling. The confidence intervals are related to the probability of successes in a Binomial experiment.

Subject:
Mathematics
Statistics and Probability
Material Type:
Activity/Lab
Provider:
Consortium for the Advancement of Undergraduate Statistics Education
Provider Set:
Causeweb.org
Author:
Anderson-Cook, C.
C.Anderson-Cook
Dorai-Raj, S.
Robinson, T.
S.Dorai-Raj
T.Robinson
Date Added:
02/16/2011
Power Applet
Conditional Remix & Share Permitted
CC BY-NC-SA
Rating
0.0 stars

The applets in this section of Statistical Java address Power. Users can perform one or two tailed tests for proportions or means for one or two samples. Set the parameters and drag the mouse across the graph to see how effect size affects power.

Subject:
Mathematics
Statistics and Probability
Material Type:
Activity/Lab
Provider:
Consortium for the Advancement of Undergraduate Statistics Education
Provider Set:
Causeweb.org
Author:
Anderson-Cook, C.
C.Anderson-Cook
Doria-Raj, S.
Robinson, T.
S.Dorai-Raj
T.Robinson
Date Added:
02/16/2011
Probability Distributions
Conditional Remix & Share Permitted
CC BY-NC-SA
Rating
0.0 stars

This page of Statistical Java describes 11 different probability distributions including the Binomial, Poisson, Negative Binomial, Geometric, T, Chi-squared, Gamma, Weibull, Log-Normal, Beta, and F. Each distribution has its own applet.

Subject:
Mathematics
Statistics and Probability
Material Type:
Activity/Lab
Provider:
Consortium for the Advancement of Undergraduate Statistics Education
Provider Set:
Causeweb.org
Author:
Anderson-Cook, C.
C.Anderson-Cook
Dorai-Raj, S.
Robinson, T.
S.Dorai-Raj
T.Robinson
Date Added:
02/16/2011
Regression
Conditional Remix & Share Permitted
CC BY-NC-SA
Rating
0.0 stars

This applet from Statistical Java allows the user to generate bivariate data for analysis with simple linear regression. The page describes the equations used to generate the data and estimate the regression lines.

Subject:
Mathematics
Statistics and Probability
Material Type:
Activity/Lab
Provider:
Consortium for the Advancement of Undergraduate Statistics Education
Provider Set:
Causeweb.org
Author:
Anderson-Cook, C.
C.Anderson-Cook
Dorai-Raj, S.
Robinson, T.
S.Dorai-Raj
T.Robinson
Date Added:
02/16/2011
The T Distribution
Conditional Remix & Share Permitted
CC BY-NC-SA
Rating
0.0 stars

This applet allows the user to adjust the degrees of freedom of the T Distribution with a slider or manual input. The applet allows the user to fix the x and or y axes. The user immediately sees how this affects the shape of the graph.

Subject:
Mathematics
Statistics and Probability
Material Type:
Activity/Lab
Provider:
Consortium for the Advancement of Undergraduate Statistics Education
Provider Set:
Causeweb.org
Author:
C.Anderson-Cook, S.Dorai-Raj, T.Robinson, Virginia Tech Department of Statistics
Date Added:
02/16/2011
The Weibull Distribution
Conditional Remix & Share Permitted
CC BY-NC-SA
Rating
0.0 stars

This applet allows the user to adjust the alpha (rate) and the beta (scale) parameters of the Gamma distribution with a slider or manual input. The user can also indicate a model (density, hazard, or reliability).

Subject:
Mathematics
Statistics and Probability
Material Type:
Activity/Lab
Provider:
Consortium for the Advancement of Undergraduate Statistics Education
Provider Set:
Causeweb.org
Author:
C.Anderson-Cook, S.Dorai-Raj, T.Robinson, Virginia Tech Department of Statistics
Date Added:
02/16/2011