Interactive log p-h diagram for displaying refrigeration cycles of different refrigerants. Automatic …
Interactive log p-h diagram for displaying refrigeration cycles of different refrigerants. Automatic calculation of the COP for heat pumps and refrigerators. Free online tool, no registration required.
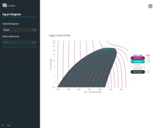
More detailed information: The thermodynamic state of a fluid (e.g. the refrigerant R134a) can be represented in state diagrams as a single point. Complete processes such as refrigeration cycles are visualized by connecting points with lines. These connecting lines correspond to changes in the state of the fluid.
In refrigeration technology, the pressure-enthalpy diagram is by far the most frequently used state diagram. The pressure is mostly scaled logarithmically, hence the name log ph diagram.
The thermodynamic properties of a refrigerant are represented in the state diagram as lines of constant state variables - so-called isolines.
No restrictions on your remixing, redistributing, or making derivative works. Give credit to the author, as required.
Your remixing, redistributing, or making derivatives works comes with some restrictions, including how it is shared.
Your redistributing comes with some restrictions. Do not remix or make derivative works.
Most restrictive license type. Prohibits most uses, sharing, and any changes.
Copyrighted materials, available under Fair Use and the TEACH Act for US-based educators, or other custom arrangements. Go to the resource provider to see their individual restrictions.