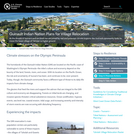
This is a problem-based learning (PBL) group jigsaw activity. The scenario is: …
This is a problem-based learning (PBL) group jigsaw activity. The scenario is: Students are employees of a unit of the United Nations responsible for coordinating disaster relief after a major disaster (the 2004 Asian Earthquake and Tsunami) occurs. The agency needs to understand the situation in each country so that it can coordinate the work of various governments and nongovernmental organizations (NGOs) working in the affected area.
Students are divided into Expert Groups (related to academic specialties such as Economics, Medicine, Political Science, Earth Science, etc.) and spend several days researching their topics. Students are then reassigned to one of seven or eight Country Groups, based on the countries most affected by the disaster. Each country group needs someone representing each expert group. In the scenario, these groups correspond to task forces that must determine what the situation is in each country and try to assess the current need for international assistance.
Students research their country, using internet resources, especially the CIA World Factbook and ReliefWeb, the information coordination website of the United Nations. At a large-group roundtable discussion, each group presents what it has found about its assigned country. As a final product, each student writes an individual report summarizing findings and making recommendations for disaster assistance.
(Note: this resource was added to OER Commons as part of a batch upload of over 2,200 records. If you notice an issue with the quality of the metadata, please let us know by using the 'report' button and we will flag it for consideration.)
Students are employees of a unit of the United Nations responsible for …
Students are employees of a unit of the United Nations responsible for coordinating disaster relief after a major disaster (the 2004 Asian Earthquake and Tsunami) occurs. The agency needs to understand the situation in each country so that it can coordinate the work of various governments and NGO (nongovernmental organizations) working in the affected area.
(Note: this resource was added to OER Commons as part of a batch upload of over 2,200 records. If you notice an issue with the quality of the metadata, please let us know by using the 'report' button and we will flag it for consideration.)
In this multi-part activity, students study seismograms from 3 different seismic stations …
In this multi-part activity, students study seismograms from 3 different seismic stations recording the magnitude 9.0 Sumatra earthquake of December 26th, 2004. By comparing the arrival times of the P and S waves on each seismogram, students determine the distance from the epicenter to each station. Using that data, they can accurately map the location of the epicenter and the precise time of the earthquake. After locating the epicenter, students calculate the position of the tsunami generated by the quake at one hour intervals. From those determinations, predictions are made about how much time people had before the tsunami crashed onto their shores. Finally, students investigate some of the ways people can lessen the impact of the next great tsunami.
(Note: this resource was added to OER Commons as part of a batch upload of over 2,200 records. If you notice an issue with the quality of the metadata, please let us know by using the 'report' button and we will flag it for consideration.)
This activity uses data collected from DART (Deep-ocean Assessment and Reporting of …
This activity uses data collected from DART (Deep-ocean Assessment and Reporting of Tsunamis) stations in the Pacific following the 2011 tsunami generated off the coast of Japan. Students are required to map the wave front after 5, 10, and 15 hours to better understand the speed and propagation of the tsunami wave.
(Note: this resource was added to OER Commons as part of a batch upload of over 2,200 records. If you notice an issue with the quality of the metadata, please let us know by using the 'report' button and we will flag it for consideration.)
This online set of activities help students learn properties of ocean waves, …
This online set of activities help students learn properties of ocean waves, wind-wave relationships and properties of tsunamis.
(Note: this resource was added to OER Commons as part of a batch upload of over 2,200 records. If you notice an issue with the quality of the metadata, please let us know by using the 'report' button and we will flag it for consideration.)
In this two-part activity, students/participants first: - Complete a Hazard Inventory for …
In this two-part activity, students/participants first: - Complete a Hazard Inventory for their city or area of interest in the event of a magnitude 7 or larger earthquake and tsunami. - Identify what critical structures and infrastructure will be affected. Then: - Write a summary statement assessing strengths and vulnerabilities of essential services or infrastructure. - Propose actions for mitigating vulnerabilities. - Create an Action Plan to address identified needs.
(Note: this resource was added to OER Commons as part of a batch upload of over 2,200 records. If you notice an issue with the quality of the metadata, please let us know by using the 'report' button and we will flag it for consideration.)
empty (Note: this resource was added to OER Commons as part of …
empty
(Note: this resource was added to OER Commons as part of a batch upload of over 2,200 records. If you notice an issue with the quality of the metadata, please let us know by using the 'report' button and we will flag it for consideration.)
This lesson introduces the concepts of wavelength and amplitude in transverse waves. …
This lesson introduces the concepts of wavelength and amplitude in transverse waves. In the associated activity, students will use ropes and their bodies to investigate different wavelengths and amplitudes.
Think science has all the answers? Think again. This course will use …
Think science has all the answers? Think again. This course will use real, authentic data to explore and investigate modern controversies in Earth Sciences. Use tide gauge records to understand how countries around the world attempt to protect themselves from tsunami events. Process seismic data to predict earthquake recurrence in the New Madrid seismic zone, right here in the breadbasket of the US. Sort through the millions of years of the geologic timeline to shed some light on what actually did, and did not, kill the dinosaurs. Finally, use global atmospheric data to understand how misrepresentation of data can be used to paint a distorted view of past, present, and future climate.
Students work in a jigsaw format, they start in an expert group …
Students work in a jigsaw format, they start in an expert group analyzing one particular aspect of the earthquake that occurred (e.g., tsunami, geologic maps, damage assessment). After analyzing the data/information provided, students get into their new groups, which are a "consulting team" to make recommendations to key governmental officials about the earthquake they studied and implications for future development. These are presented in a poster session style event, which then leads to individual papers that are written about the same topic, which are peer reviewed and revised. Students are asked to reflect on their strengths and weaknesses in the process and to consider changes for future opportunities, as well as connect the curriculum to the overall process of science.
(Note: this resource was added to OER Commons as part of a batch upload of over 2,200 records. If you notice an issue with the quality of the metadata, please let us know by using the 'report' button and we will flag it for consideration.)
Students will write a research paper comparing the Sumatran (2004) and Tohoku …
Students will write a research paper comparing the Sumatran (2004) and Tohoku (2011) tsunami generating earthquakes.
(Note: this resource was added to OER Commons as part of a batch upload of over 2,200 records. If you notice an issue with the quality of the metadata, please let us know by using the 'report' button and we will flag it for consideration.)
Students learn the two main methods to measure earthquakes, the Richter Scale …
Students learn the two main methods to measure earthquakes, the Richter Scale and the Mercalli Scale. They make a model of a seismograph a measuring device that records an earthquake on a seismogram. Students also investigate which structural designs are most likely to survive an earthquake. And, they illustrate an informational guide to the Mercalli Scale.
Earthquakes in western Washington and Oregon are to be expected -- the …
Earthquakes in western Washington and Oregon are to be expected -- the region lies in the Cascadia Subduction Zone. Offshore, the Juan de Fuca tectonic plate subducts under the North American plate, from northern California to British Columbia. The region, however, also experiences exotic seismicity -- Episodic Tremor and Slip (ETS).In this lesson, your students study seismic and GPS data from the region to recognize a pattern in which unusual tremors--with no surface earthquakes--coincide with jumps of GPS stations. This is ETS. Students model ductile and brittle behavior of the crust with lasagna noodles to understand how properties of materials depend on physical conditions. Finally, they assemble their knowledge of the data and models into an understanding of ETS in subduction zones and its relevance to the millions of residents in Cascadia.
(Note: this resource was added to OER Commons as part of a batch upload of over 2,200 records. If you notice an issue with the quality of the metadata, please let us know by using the 'report' button and we will flag it for consideration.)
In this nine-part exercise, students download NOAA high resolution bathy/topo DEMs and …
In this nine-part exercise, students download NOAA high resolution bathy/topo DEMs and TIGER census data to predict the location of shorelines, the extent of inundation, and the number of people affected by sea level rise as a result of global warming and tsunami in various parts of the coastal US; extensions include developing a Map Book report with data driven pages and locating Pleistocene land bridges. You might also be interested in our Full GIS course with links to all assignments.
(Note: this resource was added to OER Commons as part of a batch upload of over 2,200 records. If you notice an issue with the quality of the metadata, please let us know by using the 'report' button and we will flag it for consideration.)
In this lab, students learn about four different types of flood: flash …
In this lab, students learn about four different types of flood: flash floods, regional floods, storm surges, and tsunami. They then explore the human experience of flooding and who is impacted the most by flooding in general and locally in the state of WA.
(Note: this resource was added to OER Commons as part of a batch upload of over 2,200 records. If you notice an issue with the quality of the metadata, please let us know by using the 'report' button and we will flag it for consideration.)
Geysers and grizzlies and glaciers, oh my. The national parks may be …
Geysers and grizzlies and glaciers, oh my. The national parks may be America's best idea, saving the finest parts of the nation for everyone to enjoy forever. What better way to learn about the natural world than to tour the parks with us? We'll explore how the mountains and valleys formed and why they often come with volcanoes and earthquakes. You'll see what really killed the dinosaurs and how we can help save their modern relatives in the parks. With film clips, slide shows, and our geological interpretations of classic rock songs, isn't it time for a road trip?
Through a hands-on activity using salt marsh sediment cores from Pacific Northwest …
Through a hands-on activity using salt marsh sediment cores from Pacific Northwest estuaries, students will learn how these environments record the history of earthquakes and tsunami. Students will analyze the stratigraphy through visualization and touch. Students will additionally conduct an experiment to compare organic matter content within sediment sampled from different depths within the sediment core.
(Note: this resource was added to OER Commons as part of a batch upload of over 2,200 records. If you notice an issue with the quality of the metadata, please let us know by using the 'report' button and we will flag it for consideration.)
Students continue their introduction to Excel by building spreadsheets that estimate the …
Students continue their introduction to Excel by building spreadsheets that estimate the risk of a major earthquake along the Cascadia Subduction Zone to Benton County, Oregon.
No restrictions on your remixing, redistributing, or making derivative works. Give credit to the author, as required.
Your remixing, redistributing, or making derivatives works comes with some restrictions, including how it is shared.
Your redistributing comes with some restrictions. Do not remix or make derivative works.
Most restrictive license type. Prohibits most uses, sharing, and any changes.
Copyrighted materials, available under Fair Use and the TEACH Act for US-based educators, or other custom arrangements. Go to the resource provider to see their individual restrictions.