Conditional Remix & Share Permitted
CC BY-NC-SA
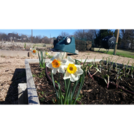
In this lesson, students will explore and record data about different plants that they observe. Students will then create a bar graph to reflect the data that that they collected. For example, a student might find 7 tomato plants, 5 cabbages, and 4 squash plants; their graph would reflect these numbers.
- Subject:
- Mathematics
- Material Type:
- Lesson Plan
- Author:
- Out Teach
- Date Added:
- 07/22/2021