Updating search results...

Climate Science for Middle School

A collection of resources that teach about the scientific aspects of climate change, including both life and earth sciences.

574 affiliated resources

Search Resources

View
Selected filters:
The American Pika: A climate indicator species?
Read the Fine Print
Educational Use
Rating
0.0 stars

This video provides a detailed description of the habitat of the American Pika and how this organism may serve as a climate indicator species because they have a relatively narrow ecological niche and specialized habitat.

Subject:
Applied Science
Biology
Career and Technical Education
Ecology
Environmental Science
Environmental Studies
Life Science
Physical Science
Material Type:
Diagram/Illustration
Reading
Provider:
CLEAN: Climate Literacy and Energy Awareness Network
Provider Set:
CLEAN: Climate Literacy and Energy Awareness Network
Author:
Earth Initiatives
Niwot Ridge Long Term Research Project
Date Added:
07/05/2021
America's Climate Choices: Advancing the Science of Climate Change
Read the Fine Print
Rating
0.0 stars

This video production is a part of a four-panel report from the National Academies' America's Climate Choices project. The video maps out the realm of our accumulated knowledge regarding climate change and charts a path forward, urging that research on climate change enter a new era focused on the needs of decision makers.

Subject:
Applied Science
Atmospheric Science
Career and Technical Education
Environmental Science
Environmental Studies
Physical Science
Provider:
CLEAN: Climate Literacy and Energy Awareness Network
Provider Set:
CLEAN: Climate Literacy and Energy Awareness Network
Author:
National Academies
Date Added:
09/24/2018
Analyzing the Urban Heat Island Effect
Read the Fine Print
Educational Use
Rating
0.0 stars

This activity covers the causes, effects, and mitigation of urban heat in New York City. Students use data sets, graphs, maps and images to create their own plan for mitigation in their area. Robust satellite images, city data, tables, maps, and graphs are included in the resource for students to explore.

Subject:
Applied Science
Career and Technical Education
Environmental Science
Environmental Studies
Physical Science
Material Type:
Activity/Lab
Provider:
CLEAN: Climate Literacy and Energy Awareness Network
Provider Set:
CLEAN: Climate Literacy and Energy Awareness Network
Author:
City of New York
Date Added:
07/05/2021
Ancient Ice and Our Planet's Future
Read the Fine Print
Rating
0.0 stars

This short video describes how the compression of Antarctic snow into ice captures air from past atmospheres. It shows how ice cores are drilled from the Antarctic ice and prepared for shipment and subsequent analysis.

Subject:
Applied Science
Career and Technical Education
Environmental Science
Environmental Studies
Physical Science
Provider:
CLEAN: Climate Literacy and Energy Awareness Network
Provider Set:
CLEAN: Climate Literacy and Energy Awareness Network
Author:
National Science Foundation
WAIS Divide Ice Core Project
Date Added:
09/24/2018
Antarctic Ice: Sea Level Change
Read the Fine Print
Educational Use
Rating
0.0 stars

What would happen if a portion of the Antarctic Ice Sheet were to melt? This video segment adapted from NOVA uses animations to show the effect of a 6-meter sea-level rise on coastal cities across the world.

Subject:
Atmospheric Science
Physical Science
Material Type:
Activity/Lab
Diagram/Illustration
Provider:
PBS LearningMedia
Provider Set:
PBS Learning Media: Multimedia Resources for the Classroom and Professional Development
Author:
National Science Foundation
WGBH Educational Foundation
Date Added:
12/17/2005
Antarctica Ice
Unrestricted Use
CC BY
Rating
0.0 stars

This short video examines the recent melting ice shelves in the Antarctica Peninsula; the potential collapse of West Antarctic ice shelf; and how global sea levels, coastal cities, and beaches would be affected.

Subject:
Physical Science
Provider:
CLEAN: Climate Literacy and Energy Awareness Network
Provider Set:
CLEAN: Climate Literacy and Energy Awareness Network
Author:
National Geographic
Date Added:
06/19/2012
Anya: Citizen Science in Siberia - Young Voices on Climate Change
Read the Fine Print
Educational Use
Rating
0.0 stars

Citizen scientist Anya, an indigenous Siberian girl, witnesses the changes in her community as a result of climate change after working with Woods Hole scientist Max Holmes' research team aboard her father's ship. She gets involved in collecting water samples to learn, and teach her schoolmates about, global warming.

Subject:
Applied Science
Career and Technical Education
Environmental Science
Environmental Studies
Physical Science
Material Type:
Diagram/Illustration
Reading
Provider:
CLEAN: Climate Literacy and Energy Awareness Network
Provider Set:
CLEAN: Climate Literacy and Energy Awareness Network
Author:
Lynne Cherry
Young Voices for the Planet
Date Added:
05/15/2012
ArcGIS Living Atlas - Indicators of the Planet
Read the Fine Print
Educational Use
Rating
0.0 stars

Living Atlas Indicators of the Planet provide the user with up-to-date data, maps, graphs, charts, animation and other visuals to explore the science of climate and environmental change. 18 indicators from Air Quality to Women in Parliament can be explored.

Subject:
Applied Science
Atmospheric Science
Biology
Career and Technical Education
Ecology
Environmental Science
Environmental Studies
Life Science
Oceanography
Physical Science
Material Type:
Reading
Provider:
CLEAN: Climate Literacy and Energy Awareness Network
Provider Set:
CLEAN: Climate Literacy and Energy Awareness Network
Author:
ArcGIS Living Atlas of the World community and partners
ESRI
Date Added:
07/09/2021
Arctic Animals and a Changing Climate
Read the Fine Print
Rating
0.0 stars

Learn about the effects of a changing climate on the Arctic ecosystem and four of its well-known mammals: the polar bear, the walrus, the Arctic fox and the beluga whale.

Subject:
Oceanography
Physical Science
Material Type:
Lesson Plan
Provider:
PBS
Provider Set:
Jean Michel Costeau: Ocean Adventures
Author:
Andrea Swensrud
Date Added:
07/16/2012
Arctic Climate Perspectives
Unrestricted Use
CC BY
Rating
0.0 stars

This video, along with a background essay, focuses on impacts of climate change on the lives of Native Alaskans around Barrow, Alaska. Specific changes include the timing of the changes in the formation and breakout of sea ice and the impacts on subsistence living.

Subject:
Applied Science
Career and Technical Education
Environmental Science
Environmental Studies
Physical Science
Provider:
CLEAN: Climate Literacy and Energy Awareness Network
Provider Set:
CLEAN: Climate Literacy and Energy Awareness Network
Author:
U.S. Department of Energy, Office of Science, Atmospheric Radiation Measurement Program and WGBH
Date Added:
06/19/2012
The Arctic: Our First Sign of Climate Change
Read the Fine Print
Arctic Sea Ice Concentrations for September (Minimum)
Read the Fine Print
Rating
0.0 stars

This animation shows the Arctic sea ice September (minimum) extents from 1979-2016. Accessible from http://nsidc.org/cryosphere/sotc/sea_ice.html

Subject:
Applied Science
Career and Technical Education
Environmental Science
Environmental Studies
Oceanography
Physical Science
Provider:
CLEAN: Climate Literacy and Energy Awareness Network
Provider Set:
CLEAN: Climate Literacy and Energy Awareness Network
Author:
National Snow and Ice Data Center
Date Added:
09/24/2018
Arctic Sea Ice Is Losing Its Bulwark
Read the Fine Print
Rating
0.0 stars

This visualization shows static and animated images of changes in Arctic sea ice 1984-2016.

Subject:
Applied Science
Career and Technical Education
Environmental Science
Environmental Studies
Physical Science
Provider:
CLEAN: Climate Literacy and Energy Awareness Network
Provider Set:
CLEAN: Climate Literacy and Energy Awareness Network
Author:
Cindy Starr
NASA Scientific Visualization Studio.
Date Added:
09/24/2018
Arctic Tundra May Contribute to Warmer World
Read the Fine Print
Educational Use
Rating
0.0 stars

In this audio slideshow, an ecologist from the University of Florida describes the radiocarbon dating technique that scientists use to determine the amount of carbon within the permafrost of the Arctic tundra. Understanding the rate of carbon released as permafrost thaws is necessary to understand how this positive feedback mechanism is contributing to climate change that may further increase global surface temperatures.

Subject:
Applied Science
Career and Technical Education
Environmental Science
Environmental Studies
Physical Science
Material Type:
Diagram/Illustration
Reading
Provider:
CLEAN: Climate Literacy and Energy Awareness Network
Provider Set:
CLEAN: Climate Literacy and Energy Awareness Network
Author:
National Science Foundation
University of Florida
Date Added:
05/15/2012
Are Humans Influencing Modern Climate?
Read the Fine Print
Rating
0.0 stars

In this short video, host Dr. Ryan interviews graduate student Amy Steiker at the Institute of Arctic and Alpine Research about her research, using isotopes of nitrous oxide, connecting human activity to greenhouse gas emissions.

Subject:
Applied Science
Atmospheric Science
Career and Technical Education
Environmental Science
Environmental Studies
Physical Science
Provider:
CLEAN: Climate Literacy and Energy Awareness Network
Provider Set:
CLEAN: Climate Literacy and Energy Awareness Network
Author:
Ryan Vachon
University of Colorado Outreach
Date Added:
09/24/2018
Are Other Parts of the World Getting Hotter?
Conditional Remix & Share Permitted
CC BY-NC
Rating
0.0 stars

In this lesson, students investigate whether other parts of the world are changing and getting hotter just like Colorado.

Subject:
Applied Science
Atmospheric Science
Environmental Science
Physical Science
Material Type:
Lesson
Provider:
University of Colorado Boulder
Provider Set:
Cooperative Institute for Research in Environmental Sciences (CIRES)
Date Added:
04/05/2018
Are Winters Getting Worse?
Conditional Remix & Share Permitted
CC BY-NC
Rating
0.0 stars

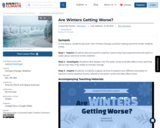
SYNOPSIS: In this lesson, students discover how climate change could be making extreme winter weather worse.

SCIENTIST NOTES: This is a great lesson that explains key drivers of winter storms. Students will learn about the polar vortex and lake effect snow and how they influence the jet stream, air circulation, and polar and mid-latitude climates. The cascading effect is worrisome, especially in vulnerable communities. The class activity will inspire students to communicate ways communities could respond to these weather events. The videos, materials, charts, and datasets embedded in the lesson were fact-checked, and this lesson has passed our science review process.

POSITIVES:
-Connecting climate change and extreme winter weather can feel counterintuitive, which will challenge students' critical thinking skills.
-The lesson provides many opportunities for students to share ideas with their peers.
-This lesson can be taught in an environmental science class.

ADDITIONAL PREREQUISITES:
-Advertisements may play before some of the videos.
-Students should be familiar with climate change, the difference between weather and climate, and the various types of extreme weather.
-Teachers should make it clear that on average, global temperatures are rising even if there is sometimes more extreme cold and snowy weather.
-Teachers should make sure students understand that this lesson is not about if anthropogenic climate change is real. Instead, this lesson is looking at the specific connections between climate change and the polar vortex and lake effect snow.

DIFFERENTIATION:
-For students who may need more support in the Investigate section, classes can create their explanations of the polar vortex and lake effect snow together.
-This lesson could be split over two class periods. In the first class, students would complete the Inquire section and the first half of the Investigate section about the polar vortex. In the second class, students would complete the second half of the Investigate section about lake effect snow and the Inspire section.

Subject:
Geoscience
Physical Science
Space Science
Material Type:
Lesson Plan
Provider:
SubjectToClimate
Author:
Effie Albitz
Date Added:
06/30/2023
Are You An Energy Efficient Consumer?
Read the Fine Print
Rating
0.0 stars

This activity engages students in learning about ways to become energy efficient consumers. Students examine how different countries and regions around the world use energy over time, as reflected in night light levels. They then track their own energy use, identify ways to reduce their individual energy consumption, and explore how community choices impact the carbon footprint.

Subject:
Geoscience
Physical Science
Material Type:
Activity/Lab
Provider:
CLEAN: Climate Literacy and Energy Awareness Network
Provider Set:
CLEAN: Climate Literacy and Energy Awareness Network
Author:
Marian Koshland Science Museum of the National Academy of Sciences
Date Added:
10/27/2014
As Permafrost Thaws, Scientists Study the Risks
Read the Fine Print
Educational Use
Rating
0.0 stars

This article and slide show from the New York Times, features several scientists from the University of Alaska, Fairbanks, who study the effects of thawing permafrost in Alaska.

Subject:
Applied Science
Biology
Career and Technical Education
Chemistry
Environmental Science
Environmental Studies
Geology
Life Science
Physical Science
Material Type:
Reading
Simulation
Provider:
CLEAN: Climate Literacy and Energy Awareness Network
Provider Set:
CLEAN: Climate Literacy and Energy Awareness Network
Author:
Josh Haner
New York Times
Date Added:
08/29/2012
Assessing Drought in the United States
Read the Fine Print
Educational Use
Rating
0.0 stars

This easy-to-understand video animation describes drought and explains the different categories of drought used by the drought monitor. It discusses the effects of and contributions to drought, what the implications of the different drought levels are, and puts the drought maps into context to understand how the impacts vary geographically (e.g. drought in Nevada vs Kansas - one could affect tourism, the other agriculture). It also touches on how the development of maps/drought severity is determined and how it might vary geographically. The animation provides a basic overview of statistics and percentiles and the concept of '100 year events.'

Subject:
Agriculture
Applied Science
Atmospheric Science
Career and Technical Education
Economics
Environmental Science
Environmental Studies
Physical Science
Social Science
Material Type:
Diagram/Illustration
Reading
Provider:
CLEAN: Climate Literacy and Energy Awareness Network
Provider Set:
CLEAN: Climate Literacy and Energy Awareness Network
Author:
CoCoRaHS
Colorado Climate Center
Date Added:
06/25/2019