Data warehouse Design Using Oracle
Unit Objective:
This module concentrates on On-Line analytical Processing (OLAP). This module gives more information about using SQL statement doing OLAP operation like slice, dice, drill-down, rollup, cube and Group sets.
3.1 DIMENSIONAL MODELING
A data cube allows data to be modeled and viewed in multiple dimensions. The data cubes are n-dimensional.In the data warehouse, an n-D base cube is called a Base Cuboid which holds the lowest level of summarization. The base cuboid for the given lattices is time, item, location, and supplier dimensions. The top most 0-D Cuboid is called a apex Cuboid which holds the highest-level of summarization is called apex cuboid. For example total sales or dollars sold, Summarized for all four dimensions. The apex cuboid is typically denoted by all. The lattice (i.e. network) of cuboids forms a data cube.
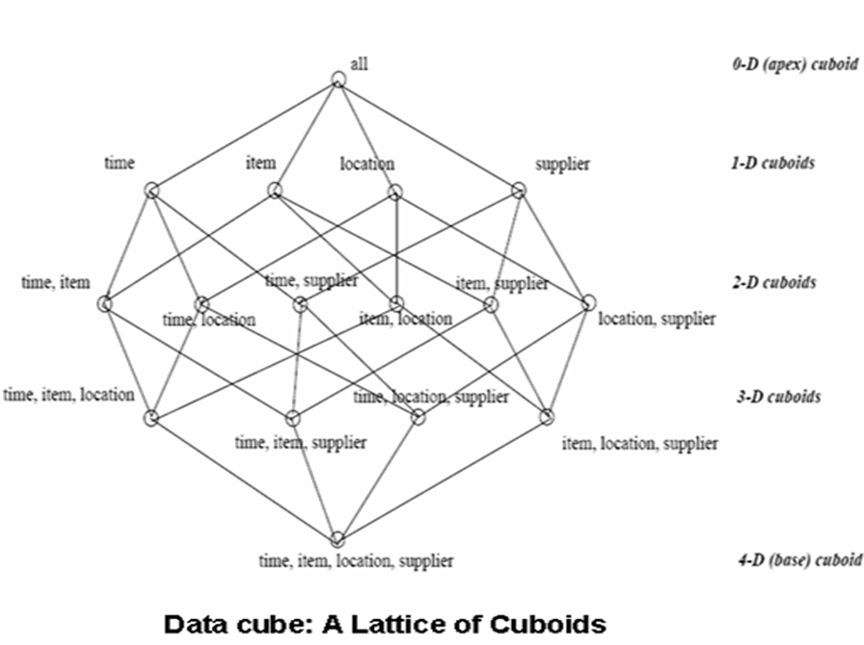
Lattice of Cuboids
3.2 Slice Operation
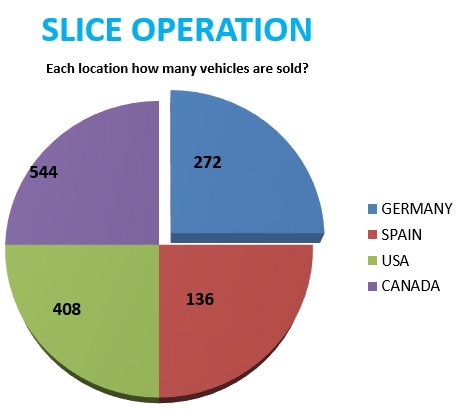
Slice
The slice operation performs a selection on one dimension of the given cube, resulting in a sub cube.
The slice operator retrieves a subset of a data cube similar to the restriction operator of relational algebra.
Query:
Write a statement to display how many vehicles sold in location Germany.
SELECT location_key, sum(Vechicle_sold) from Sales_Fact where(location_key =1) group by location_key;
LOCATION_KEY SUM(VECHICLE_SOLD)
----------------------------------------------------------
1 272
OUTPUT EXPLANATION
The 272 value is sum of ((1,1,1), (1,1,2), (1,1,3), (1,1,4), (1,2,1), (1,2,2), (1,2,3), (1,2,4), (1,3,1), (1,3,2), (1,3,3), (1,3,4), (1,4,1), (1,4,2), (1,4,3), (1,4,4))
Total Number of Rows is 16
Sum of Rows are from 1.1.1, 1.1.2….1.4.4
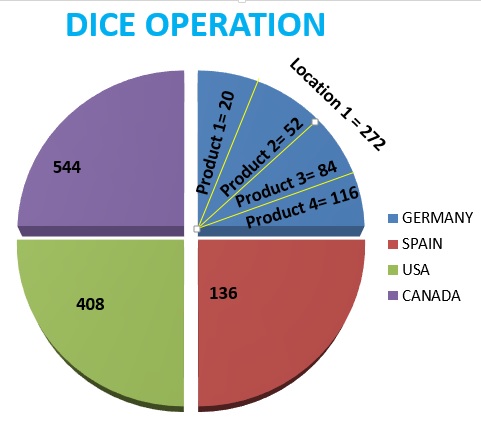
3.3 Dice Operation
The dice operation defines a sub cube by performing a selection on two or more dimensions.
In other words, by specifying value ranges on one or more dimensions, the user can highlight meaningful blocks of aggregated data.
The dice operation is a slice on more than two dimensions of a data cube (or more than two consecutive slices.
Dice
Query: Display location key , Total number of Small car (product key =1) sold in location Germany (i.e location one)
Statement:
SQL> SELECT location_key, sum(Vechicle_sold) from Sales_Fact where(location_key =1) and (product_key=1) group by location_key;
OUTPUT
LOCATION_KEY SUM(VECHICLE_SOLD)
------------------------------------------------------------------------------------------
1 20
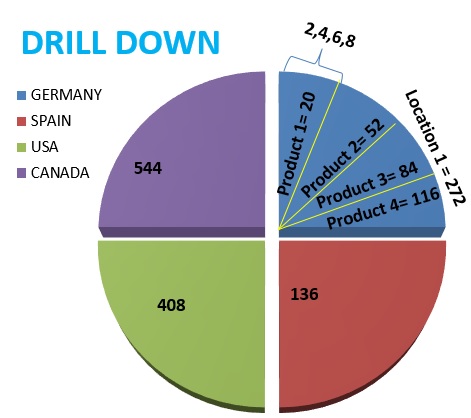
3.4 Drill Down Operation
Drill-down function allows users to obtain a more detailed view of a given dimension
Drill Down
Query:
Write a statement to display location key, how many small car product sold in location Germany.
Statement:
SQL> SELECT location_key, Vechicle_sold from Sales_Fact where(location_key =1) and (product_key=1);
OUTPUT
LOCATION_KEY VECHICLE_SOLD
------------ -----------------------------------
1 2
1 4
1 6
1 8
OUTPUT EXPLANATION
The values are from (1,1,1),(1,1,2),(1,1,3),(1,1,4)
3.5 Rollup Operation
3.6 Cube Operation
3.7 Grouping Sets Operation
3.8 Pivot
A Pivot query can be written as follows:
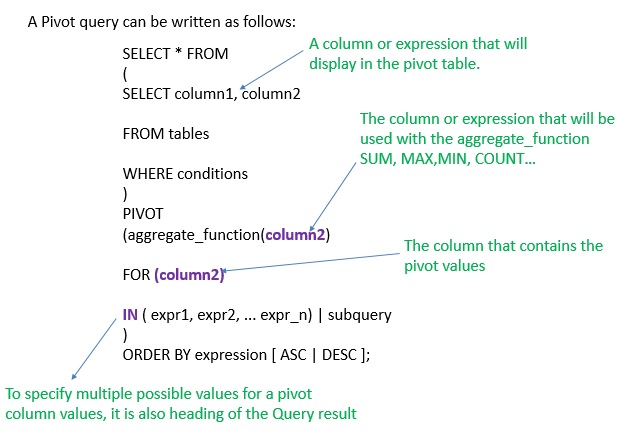
pivot syntax
Parameters or Arguments
Aggregate function
It can be a function such as SUM, COUNT, MIN, MAX,
or AVG functions.
IN ( expr1, expr2, ... expr_n )
A list of values for column2 to pivot into headings in the cross-tabulation query results.
subquery
It can be used instead of a list of values. In this case, the results of the subquery would be used to determine the values for column2 to pivot into headings in the cross-tabulation query results.
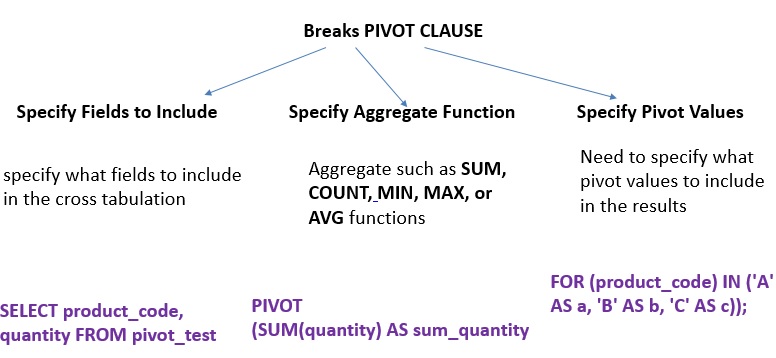
pivot breaks
CREATE TABLE pivot_test (
id NUMBER,
customer_id NUMBER,
product_code VARCHAR2(5),
quantity NUMBER
);
INSERT INTO pivot_test VALUES (1, 1, 'A', 10);
INSERT INTO pivot_test VALUES (2, 1, 'B', 20);
INSERT INTO pivot_test VALUES (3, 1, 'C', 30);
INSERT INTO pivot_test VALUES (4, 2, 'A', 40);
INSERT INTO pivot_test VALUES (5, 2, 'C', 50);
INSERT INTO pivot_test VALUES (6, 3, 'A', 60);
INSERT INTO pivot_test VALUES (8, 3, 'C', 80);
INSERT INTO pivot_test VALUES (9, 3, 'D', 90);
INSERT INTO pivot_test VALUES (10, 4, 'A', 100);
COMMIT;
Write a Pivot statement to display Total Quantity sold in each product.
SELECT * FROM
(SELECT product_code, quantity FROM pivot_test)
PIVOT
(SUM(quantity) AS sum_quantity FOR (product_code) IN ('A' AS a, 'B' AS b, 'C' AS c));
Unit summary
Practical Exercise
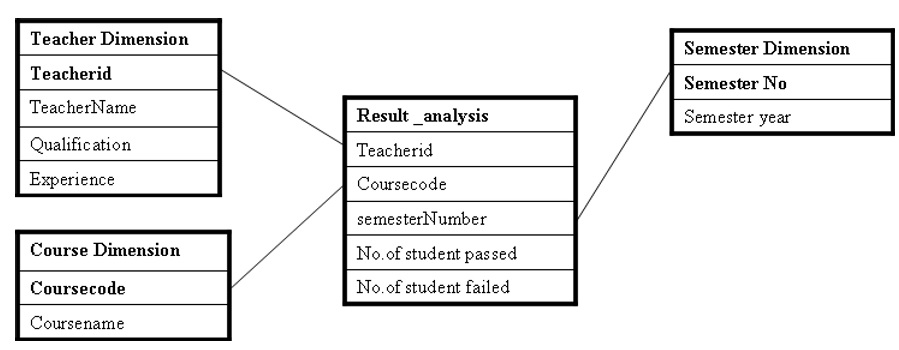
Schema design exercise 1
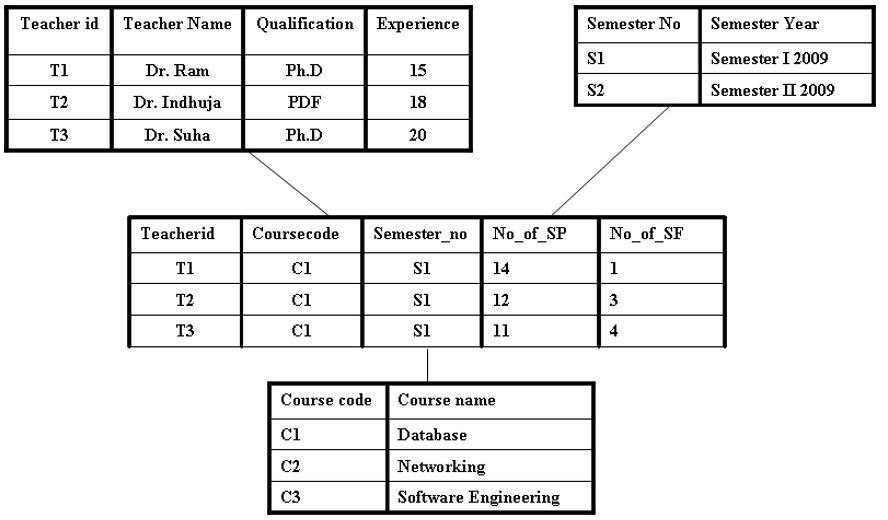
Exercise 1 -figure 2
Q1:
Write an appropriate SQL statement of total number of student passed in semester one in the entire course taken by all three teachers.
Q2:
Write an appropriate SQL statement of total number of student passed in semester two in the entire course taken by all three teachers
Q3:
Write an appropriate SQL statement total number of student Failed in semester one in the entire course taken by all three teachers.
Q4:
Write an appropriate SQL statement of total number of student Failed in semester two in the entire course taken by all three teachers.
Q5:
Write an appropriate SQL statement to display semester number, course code, number of student failed in semester two in course code C1.
Q6:
Write an appropriate SQL statement to display teacher id, course code, total number of student passed in course code c1 and teacher id T1.
Q7:
Write an appropriate SQL statement to display teacher id, course code, number of student passed in semester S1 and teacher id is T1.
Q8:
Write an appropriate SQL statement using ROLLUP operation to display semester number, teacher id, course code, total number of student passed only for semester number S1
Pivot Exercise 1
CREATE TABLE orders
( order_id number(6) primary key,
customer_ref varchar2(25) NOT NULL,
product_id number,
ORDER_DATE DATE,
quantity number
);
insert into orders values(1,'MALIK',10,'20-NOV-2017',100);
insert into orders values(2,'MALIK',20,'23-NOV-2017',20);
insert into orders values(3,'SALIM',10,'01-DEC-2017',5);
insert into orders values(4,'SALIM',20,'30-DEC-2017',4);
insert into orders values(5,'SALIM',30,'04-JAN-2018',5);
insert into orders values(6,'MALIK',30,'04-JAN-2018',6);
insert into orders values(7,'ZULFA',10,'23-NOV-2017',15);
insert into orders values(8,'ZULFA',20,'01-DEC-2017',12);
insert into orders values(9,'ZULFA',10,'01-DEC-2017',6);
commit;
Write a Pivot statement to display how many times the customer purchased the same product. The product is categorized based on product_id.
Pivot Exercise 2
Create emp_salary table with following values:
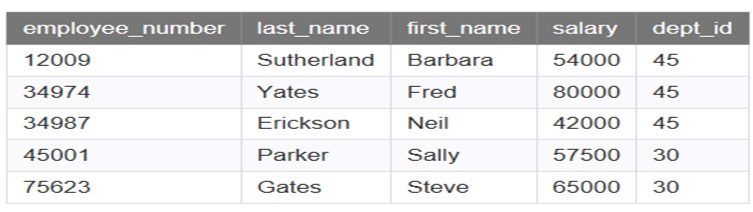
pivot table creation
Create a pivot table to display the total salary for dept_id 30 and dept_id 45, the result should be display like this
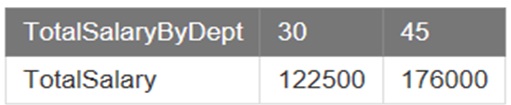
pivot result
Question
Video Tutorial Link
Lecture Notes
References
1. https://www.techonthenet.com/sql_server/pivot.php
2. https://oracle-base.com/articles/11g/pivot-and-unpivot-operators-11gr1#pivot
3. https://www.techonthenet.com/oracle/pivot.php