Before engaging in lessons, students attempt to draw a diagram of a …
Before engaging in lessons, students attempt to draw a diagram of a nitrogen cycle and add as many components as they can. This allows them to self-assess (and the teacher to assess) what they know about the nitrogen cycle.
Students research some of the nitrogen cycle components online at various websites or read printouts from websites provided by the teacher. They choose three or four facts of interest about their component and report to the rest of the class.
Each small group of students is given a set of materials including 20 objects, 20 picture-cards, 20 nitrogen cycle component explanation cards, 20 title cards for each nitrogen cycle component, heading cards for different environments such as the atmosphere, soil, water, etc., and many small arrows. The students work together to pair each object with its corresponding title card, description card, and picture card. Then these are all arranged to form a possible nitrogen cycle with various components clustered around heading cards and arrows used to show movement of nitrogen from one object to another.
Students then write humorous (limerick, couplet) poems or more serious poems (haiku) or structured poems (cinquain, diamante) to tell several facts about a component of the nitrogen cycle. They share their poems with the class. Students may also engage in experiments with nitrogen fertilizer.
(Note: this resource was added to OER Commons as part of a batch upload of over 2,200 records. If you notice an issue with the quality of the metadata, please let us know by using the 'report' button and we will flag it for consideration.)
This is an in-class activity. I used it relatively early in the …
This is an in-class activity. I used it relatively early in the semester, after covering the basic water properties portion of the class. I use the relationship between temperature/salinity/density to begin discussing vertical movement of water. The first purpose of this activity is to reinforce the concepts that have just been explained about the relationship between temperature and density and salinity and density. The second purpose is to bring these ideas back to what they have learned about density differences. Finally, the activity is also designed to help them learn how to read graphs.
(Note: this resource was added to OER Commons as part of a batch upload of over 2,200 records. If you notice an issue with the quality of the metadata, please let us know by using the 'report' button and we will flag it for consideration.)
Thermodynamics and Chemistry is designed primarily as a textbook for a one-semester …
Thermodynamics and Chemistry is designed primarily as a textbook for a one-semester course in classical chemical thermodynamics at the graduate or undergraduate level. It can also serve as a supplementary text and thermodynamics reference source.
Short Description: This book is designed as a succinct and focused resource, …
Short Description: This book is designed as a succinct and focused resource, specifically aimed to help students grasp key threshold concepts in Biochemistry. Due to their troublesome nature, understanding threshold concepts is a cognitively demanding task. By using a series of thematically linked case studies that accompany theory, the cognitive load will be reduced. This will free up students to focus on learning concepts rather than distracting them with unnecessary specifics. Please note this book is being published iteratively and the final four chapters will be available in the first half of 2024.
Long Description: Biochemistry (and Molecular Biology) represent one of the fastest-growing fields of scientific research and technical innovation and the resulting biotechnology is increasingly applied to other fields of study. So, an understanding of Biochemistry is increasingly important for students in all biological disciplines. However, at the same time, the content is inherently complex, highly abstract, and often deeply rooted in the pure sciences – mathematics, chemistry, and physics. This makes it difficult to both learn and to teach.
This book is designed as a succinct and focused resource, specifically aimed to help students grasp key threshold concepts in Biochemistry. Due to their troublesome nature, understanding threshold concepts is a cognitively demanding task. By using a series of thematically linked case studies that accompany theory, the cognitive load will be reduced. This will free up students to focus on learning concepts rather than distracting them with unnecessary specifics.
Word Count: 18579
ISBN: 978-0-6484681-9-6
(Note: This resource's metadata has been created automatically by reformatting and/or combining the information that the author initially provided as part of a bulk import process.)
This lab is designed to familiarize students with the geologic history of …
This lab is designed to familiarize students with the geologic history of an ore-deposit, deciphered in the palm of your hand. By determining cross cutting relations of veins and mineralogy, students decipher the evolution of mineralizing fluids that formed the minerals of a copper ore deposit.
This lab accompanies lectures/classes in economic geology and ore mineralogy, either in a mineralogy or petrology course. It can also accompany studies of fluid rock interactions, fracture flow, fluid evolution, or geochemistry; or these topics be woven together using this lab as a base. This lab exercise also integrates previously learned material: cross-cutting relationships (Introductory Geology),with determination of mineralogy (Mineralogy), review of idochromatic elements producing color and their use in mineral identification (Mineralogy),chemistry of the fluids (Geochemistry), and changes in fluids with time during hydrothermal alteration events (Economic Geology). It also demonstrates the linkage between fluid composition, igneous petrology, ore geology and mineralogy.
(Note: this resource was added to OER Commons as part of a batch upload of over 2,200 records. If you notice an issue with the quality of the metadata, please let us know by using the 'report' button and we will flag it for consideration.)
Using a jigsaw approach, students investigate biogeochemical transformations of water as it …
Using a jigsaw approach, students investigate biogeochemical transformations of water as it moves through the hydrologic cycle. In the first phase, student groups are given a schematic representation of the hydrologic cycle with representative concentrations of a single variable (nitrate, silica, pH and conductivity) provided for oceans, precipitation, streams, and shallow and deep groundwater. After each group has achieved a satisfactory explanation of its own variable, students are recombined to explain and compare the processes that control each variable, and to look for common themes (e.g., weathering reactions in subsurface increase conductivity, silica and pH). The resulting conceptual framework facilitates use of water-quality variables as tracers to interpret runoff processes and stream-flow sources.
(Note: this resource was added to OER Commons as part of a batch upload of over 2,200 records. If you notice an issue with the quality of the metadata, please let us know by using the 'report' button and we will flag it for consideration.)
This is an activity about transport of sediment contaminated by copper, arsenic, …
This is an activity about transport of sediment contaminated by copper, arsenic, and other heavy metals that was deposited into the Clark Fork River channel as the result of historical mining activity. The Clark Fork River between Butte and Milltown, Montana has been the focus of several large superfund projects designed to address the impacts of this legacy of mining in the watershed. This activity is used in an introductory physical geology lab (primarily non-majors) with students who may have limited experience working with quantitative analysis and analyzing graphs.
(Note: this resource was added to OER Commons as part of a batch upload of over 2,200 records. If you notice an issue with the quality of the metadata, please let us know by using the 'report' button and we will flag it for consideration.)
All cells, organs and tissues of a living organism are built of …
All cells, organs and tissues of a living organism are built of molecules. Some of them are small, made from only a few atoms. There is, however, a special class of molecules that make up and play critical roles in living cells. These molecules can consist of many thousands to millions of atoms. They are referred to as macromolecules (or large biomolecules).
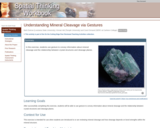
Students use gesture to convey information about mineral cleavage and the relationship …
Students use gesture to convey information about mineral cleavage and the relationship between crystal structures and cleavage planes.
(Note: this resource was added to OER Commons as part of a batch upload of over 2,200 records. If you notice an issue with the quality of the metadata, please let us know by using the 'report' button and we will flag it for consideration.)
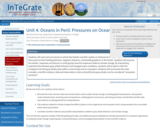
In this unit, students explore the role of ocean circulation in climate …
In this unit, students explore the role of ocean circulation in climate modification and bioproductivity. The activities require students to interpret the effect of horizontal and vertical seawater movement on heat distribution, carbon dioxide dissolution, and nutrient availability. Students will use their new knowledge to predict how those parameters may change as a result of major shifts in ocean circulation associated with global climate change.
(Note: this resource was added to OER Commons as part of a batch upload of over 2,200 records. If you notice an issue with the quality of the metadata, please let us know by using the 'report' button and we will flag it for consideration.)
In this three to four class unit, students will: Assess the case …
In this three to four class unit, students will:
Assess the case for a global water crisis and its relevance in America. Expand their understanding of sustainability as a contestable concept and movement. Consider water resource-management objectives through the lens of sustainability. Analyze region-specific examples of unsustainable use of water for agriculture.
This is largely achieved via student discussion and evaluation of texts and statistics provided to them. The text and statistics are derived from a variety of disciplines, mostly not from the geosciences. As such, the unit is very interdisciplinary, requiring students to synthesize disparate information and take a holistic perspective on water issues.
(Note: this resource was added to OER Commons as part of a batch upload of over 2,200 records. If you notice an issue with the quality of the metadata, please let us know by using the 'report' button and we will flag it for consideration.)
Students will learn about geoscience-specific methods used to analyze data in the …
Students will learn about geoscience-specific methods used to analyze data in the Critical Zone from data-driven activities and short presentations by their peers. The topics include the use of carbon isotopes, rock and soil profile weathering rates, stream discharge, demographics, and soil carbon. Activities will build data analysis and communication skills while using real data to interpret Critical Zone processes and begin to think about human interactions in the Critical Zone. Students will use geoscience-specific methods when developing their research proposal for the summative assessment activity.
(Note: this resource was added to OER Commons as part of a batch upload of over 2,200 records. If you notice an issue with the quality of the metadata, please let us know by using the 'report' button and we will flag it for consideration.)
In this activity, students model the impact of changes in land cover …
In this activity, students model the impact of changes in land cover on stormwater runoff using the EPA's National Stormwater Calculator. Students mitigate increased stormwater runoff resulting from development with low impact development (LID) controls. Students assess the LID controls in terms of the ecosystem services that they are intended to replace and discuss alternative development designs to reduce the need for them.
(Note: this resource was added to OER Commons as part of a batch upload of over 2,200 records. If you notice an issue with the quality of the metadata, please let us know by using the 'report' button and we will flag it for consideration.)
Electrical measurement of unconsolidated soils in the laboratory. Provenance: Lee Slater, Rutgers …
Electrical measurement of unconsolidated soils in the laboratory.
Provenance: Lee Slater, Rutgers University-Newark Reuse: This item is in the public domain and maybe reused freely without restriction. Archie (1950) defined the term petrophysics to describe the study of the physics of rocks, particularly with respect to the fluids they contain. Although originally focused on geophysical exploration, petrophysics concepts are now used to interpret near surface geophysics measurements made to address environmental and engineering problems. This unit investigates relationships between these geophysical measurements and the physical and chemical properties of soils and sediments in the Earth's near subsurface. The specific focus is on the electrical properties of soils and how they are related to the ionic concentration of the pore fluids, the water content, porosity and grain size. Field results from a geophysical survey performed in Kearny Marsh, close to Harrier Meadow, are included to illustrate how electrical conductivity of a soil measured with an electromagnetic sensor is a good proxy for pore fluid ionic concentration, in this case related to contamination from a bordering landfill.
(Note: this resource was added to OER Commons as part of a batch upload of over 2,200 records. If you notice an issue with the quality of the metadata, please let us know by using the 'report' button and we will flag it for consideration.)
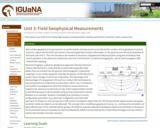
Near surface geophysical measurements are performed by moving sensors across the Earth's …
Near surface geophysical measurements are performed by moving sensors across the Earth's surface. Active geophysical sensors transmit a signal into the Earth and record a returned signal that contains information on the physical and chemical properties of the Earth (see Unit 2). This unit introduces the student to the basics of geophysical data acquisition using two techniques that record variations in the electrical conductivity (see Unit 2) of the Earth: [1] electrical imaging (EI), and [2] electromagnetic (EM) conductivity mapping.
Basic concept of electrical imaging measurements
Provenance: Lee Slater, Rutgers University-Newark Reuse: This item is in the public domain and maybe reused freely without restriction. Electrical imaging is a galvanic geophysical approach whereby electrical contact with the Earth is made directly via electrodes (typically metal stakes) that are inserted into the ground. Electromagnetic conductivity mapping is a non-contact approach whereby the physics of EM induction is used to sense changes in electrical conductivity. The advantages and disadvantages of using galvanic (EI) and non-contact (EM) techniques for measuring electrical conductivity are described. Ohm's Law is introduced and students investigate how electrical resistance measurements are related to the electrical conductivity of soils. Field implementation of both EI and EM techniques is demonstrated using surveys performed in Harrier Meadow as an example. Students investigate how variations in survey configuration parameters (e.g. electrode configuration and electrode spacing in EI, frequency and coil spacing in EM) control investigation depth (how far into the ground the signals sense) and spatial resolution (what size objects can be detected). The concept of pre-modeling a geophysical survey (i.e. running some simulations of likely effectiveness of the methods before going to the field) to evaluate expected investigation depth and sensitivity is introduced. The Excel-based Scenario Evaluator for Electrical Resistivity (SEER) tool provided by the United States Geological Survey (USGS) is used to demonstrate some key concepts.
(Note: this resource was added to OER Commons as part of a batch upload of over 2,200 records. If you notice an issue with the quality of the metadata, please let us know by using the 'report' button and we will flag it for consideration.)
Students will be able to identify the functional roles that organisms play …
Students will be able to identify the functional roles that organisms play in ocean ecosystems. How do human-induced changes in ocean conditions affect biodiversity, and thereby the health and resilience of a coral reef? Students explore and discuss the direct and indirect impacts that ocean acidification can have on species, food web dynamics, ecosystem function, and commercial resources. At the end of this unit the students should be able to articulate how changes in ocean chemistry can create negative outcomes for humans who depend on living ocean resources.
(Note: this resource was added to OER Commons as part of a batch upload of over 2,200 records. If you notice an issue with the quality of the metadata, please let us know by using the 'report' button and we will flag it for consideration.)
The purpose of this unit is to explore, compare, contrast, and calculate …
The purpose of this unit is to explore, compare, contrast, and calculate energy fluxes from different CZO field sites to better appreciate the critical differences in the driving radiative forces affecting each site. This module will help students complete their semester-long project by introducing them to critical baseline data collection and databases related to energy budgets. The primary data set for this activity is the CZO tower network of a dozen met/flux towers spanning six different biomes/sites. Each site has a slightly different data format but it is easily manipulated in a spreadsheet. The lesson is divided into the following engaging activities:
Background lecture: Introduction to water and energy fluxes and balances Database access and graphing activity: Students will learn what data exists in the CZO database and how to load and manipulate it using Excel. Discovery activity: Students in small groups will compare monthly bar graphs of energy fluxes drawn from six Ameriflux sites and address questions concerning linkages with other variables and processes affecting energy partitioning. Reference ET Activity: Students will learn about the Penman-Monteith formulation of evaporation and calculate this from common meteorological data and compare with field measurements of evapotranspiration. The class will discuss these results as time allows.
(Note: this resource was added to OER Commons as part of a batch upload of over 2,200 records. If you notice an issue with the quality of the metadata, please let us know by using the 'report' button and we will flag it for consideration.)
The purpose of this unit is to explore, compare, contrast, and interpret …
The purpose of this unit is to explore, compare, contrast, and interpret carbon fluxes from the Ameriflux network to better appreciate the critical factors that account for the different timing and magnitudes of fluxes among these sites. This module will help students complete their semester-long project by introducing them to critical baseline data collection and databases related to carbon budgets. The primary data set for this activity is the Amerflux network database, which spans over 150 sites throughout the Americas. Each data set is uniformly formatted and can contain up to 45 fields of meteorological and flux data collected from various eddy correlation tower instruments. The lesson is divided up between the following engaging activities:
Background lecture: Introduction to carbon fluxes and balances Discovery Activity: Students in small groups will compare various annual flux records from four different sites to address questions regarding driving variables, correlation among variables, and causative factors responsible for the overall trend in annual CO2 flux. Group results will be shared and discussed by the whole class as time allows. Database Access Activity: Students will learn what data exists in the Ameriflux data base and how to load it into an Excel spreadsheet for display using an Amerflux site that also is part of the CZO network. Carbon Flux Hypothesis Activity: Students will develop a simple hypothesis regarding the timing and/or magnitude of CO2 fluxes and use data from the Ameriflux database to support their ideas.
(Note: this resource was added to OER Commons as part of a batch upload of over 2,200 records. If you notice an issue with the quality of the metadata, please let us know by using the 'report' button and we will flag it for consideration.)
Students will read and summarize an article that details scientific studies on …
Students will read and summarize an article that details scientific studies on behavioral changes of gray whales. Discussed are their feeding behavior, migratory behavior, and breeding patterns in the Pacific. Students will examine the whales' responses and discuss in small groups how the responses relate to climate change. By interpreting potential links between gray whale behavior and changed ocean conditions, students will be able to infer the ecological role that gray whales play within a community and an ecosystem. Students will summarize the main concepts, scientific evidence, data and observations cited, and justify why gray whales can be considered "ecosystem sentinels."
(Note: this resource was added to OER Commons as part of a batch upload of over 2,200 records. If you notice an issue with the quality of the metadata, please let us know by using the 'report' button and we will flag it for consideration.)
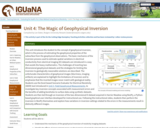
The concepts of forward modeling and inverse modeling Provenance: Lee Slater, Rutgers …
The concepts of forward modeling and inverse modeling
Provenance: Lee Slater, Rutgers University-Newark Reuse: If you wish to use this item outside this site in ways that exceed fair use (see http://fairuse.stanford.edu/) you must seek permission from its creator. This unit introduces the student to the concept of geophysical inversion, which is the process of estimating the geophysical properties of the subsurface from the geophysical observations. The basic mechanics of the inversion process used to estimate spatial variations in electrical conductivity from electrical imaging (EI) datasets are introduced in a way that avoids the heavy mathematics. The challenges of inverting two dimensional geophysical datasets and the strategies for limiting the inversion to geologically reasonable solutions are described. The unfortunate characteristics of geophysical images (blurriness, imaging artifacts) are explained to highlight the limitations of inversion and to emphasize that the inverted images never match with geological reality. Students use the Excel-based Scenario Evaluator for Electrical Resistivity (SEER) tool introduced in Unit 3, Field Geophysical Measurements, to investigate key inversion concepts associated with measurement errors and the benefits of adding boreholes to surface data using synthetic datasets. Students are then led through an inversion of the two-dimensional EI dataset acquired in Harrier Meadow using ResIPy, a Python-based graphical user interface developed for instructional use. Following the instructional video, students then perform the inversion in ResIPy themselves and explore how variations in inversion settings related to the errors in the measurements result in distinctly different images.
(Note: this resource was added to OER Commons as part of a batch upload of over 2,200 records. If you notice an issue with the quality of the metadata, please let us know by using the 'report' button and we will flag it for consideration.)
No restrictions on your remixing, redistributing, or making derivative works. Give credit to the author, as required.
Your remixing, redistributing, or making derivatives works comes with some restrictions, including how it is shared.
Your redistributing comes with some restrictions. Do not remix or make derivative works.
Most restrictive license type. Prohibits most uses, sharing, and any changes.
Copyrighted materials, available under Fair Use and the TEACH Act for US-based educators, or other custom arrangements. Go to the resource provider to see their individual restrictions.