Updating search results...

Search Resources

468 Results

View
Selected filters:
  • Chemistry
  • College / Upper Division
  • Community College / Lower Division
  • Activity/Lab
  • Textbook
Volcanic Features
Read the Fine Print
Educational Use
Rating
0.0 stars

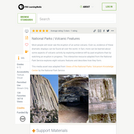
This interactive resource adapted from the National Park Service illustrates the variety of landforms and features created by volcanoes. Featured are calderas, craters, fumaroles and other geothermal features, igneous rocks, lava flows, lava tubes, and maars.

Subject:
Astronomy
Chemistry
Education
Geology
Geoscience
Physical Geography
Physical Science
Physics
Space Science
Material Type:
Activity/Lab
Diagram/Illustration
Interactive
Provider:
PBS LearningMedia
Provider Set:
PBS Learning Media: Multimedia Resources for the Classroom and Professional Development
Author:
National Science Foundation
WGBH Educational Foundation
Date Added:
12/17/2005
Volcanoes Around the Globe
Conditional Remix & Share Permitted
CC BY-NC-SA
Rating
0.0 stars

Before completing this computer-based activity, students need to learn basic (Earth Science 101) information about volcanic rocks and hazards, and they also need to learn how to interpret a histogram. Students complete the activity individually outside class time in a computer lab equipped with Arcview3.3 geographic information system (GIS) software. They do not need any prior experience with GIS because the activity text includes step-by-step instructions accompanied by numerous screen shots. Students use the GIS to investigate geochemical data from the global Earthchem database and, for the Mount Hood, Oregon area, the NAVDAT database. Students also use maps and satellite images to learn about volcanic hazards at Mount Hood. Through all of these investigations, they learn about the connections between the silica content of a melt, volcanic hazards, and plate tectonics. Hundreds of students have successfully completed the activity at Middle Tennessee State University in Murfreesboro, TN, but the activity is still considered a "beta test copy" and the author welcomes feedback. Funding has been provided by small grants from the NASA Earth Observing System Higher Education Alliance ("GeoBrain"), Tennessee Space Grant, and NSF.

(Note: this resource was added to OER Commons as part of a batch upload of over 2,200 records. If you notice an issue with the quality of the metadata, please let us know by using the 'report' button and we will flag it for consideration.)
Subject:
Biology
Chemistry
Life Science
Physical Science
Material Type:
Activity/Lab
Data Set
Lesson Plan
Provider:
Science Education Resource Center (SERC) at Carleton College
Provider Set:
Teach the Earth
Author:
Mark Abolins
Date Added:
08/07/2019
Volcanoes around the Globe (Beta test copy)
Conditional Remix & Share Permitted
CC BY-NC-SA
Rating
0.0 stars

Before completing this computer-based activity, students need to learn basic (Earth Science 101) information about volcanic rocks and hazards, and they also need to learn how to interpret a histogram. Students complete the activity individually outside class time in a computer lab equipped with Arcview3.3 geographic information system (GIS) software. They do not need any prior experience with GIS because the activity text includes step-by-step instructions accompanied by numerous screen shots. Students use the GIS to investigate geochemical data from the global GEOROC database and, for the Mount Hood, Oregon area, the NAVDAT database. Students also use maps and satellite images to learn about volcanic hazards at Mount Hood. Through all of these investigations, they learn about the connections between the silica content of a melt, volcanic hazards, and plate tectonics. Hundreds of students have successfully completed the activity at Middle Tennessee State University in Murfreesboro, TN, but the activity is still considered a "beta test copy" and the author welcomes feedback. Funding has been provided by small grants from the NASA Earth Observing System Higher Education Alliance ("GeoBrain"), Tennessee Space Grant, and NSF.

(Note: this resource was added to OER Commons as part of a batch upload of over 2,200 records. If you notice an issue with the quality of the metadata, please let us know by using the 'report' button and we will flag it for consideration.)
Subject:
Biology
Chemistry
Life Science
Physical Science
Material Type:
Activity/Lab
Provider:
Science Education Resource Center (SERC) at Carleton College
Provider Set:
Teach the Earth
Author:
Mark Abolins
Date Added:
09/12/2021
Wastewater Treatment
Conditional Remix & Share Permitted
CC BY-NC-SA
Rating
0.0 stars

Before this activity the students will have heard about groundwater and water resources through lecture to give them a background on where our drinking water comes from. The activity involves a tour of the local wastewater treatment plant where the students told about the treatment processes and shown the treatment facility. They are also introduced to the water quality testing done at the plans and they learn about the energy usage/management at the plant. As part of the activity they write up a paper on the processes in the treatment process from the time water enters the plant until it exits. The students are encouraged before hand to ask questions to ensure that they gather the needed information. This always means that each tour has a slightly different content based on these questions.

(Note: this resource was added to OER Commons as part of a batch upload of over 2,200 records. If you notice an issue with the quality of the metadata, please let us know by using the 'report' button and we will flag it for consideration.)
Subject:
Chemistry
Physical Science
Material Type:
Activity/Lab
Homework/Assignment
Provider:
Science Education Resource Center (SERC) at Carleton College
Provider Set:
Teach the Earth
Author:
Bianca Pedersen
Date Added:
08/30/2019
Water Quality
Conditional Remix & Share Permitted
CC BY-NC-SA
Rating
0.0 stars

Students use a microcomputer connected to a conductivity probe to measure the total dissolved solids in local area water samples.

(Note: this resource was added to OER Commons as part of a batch upload of over 2,200 records. If you notice an issue with the quality of the metadata, please let us know by using the 'report' button and we will flag it for consideration.)

Subject:
Chemistry
Hydrology
Mathematics
Measurement and Data
Physical Science
Material Type:
Activity/Lab
Data Set
Lesson Plan
Provider:
Science Education Resource Center (SERC) at Carleton College
Provider Set:
Teach the Earth
Author:
This activity is taken from Earth Science With Vernier by Robyn Johnson, Gretchen Stahmer DeMoss, and Richard Sorensen, Published by , Vernier Software (more info) . This Starting Point page was created by Robert MacKay, of Clark College .
Date Added:
09/19/2022
Water Quality Analysis
Unrestricted Use
CC BY
Rating
0.0 stars

This is Experiment #4 in the Analytical Chemistry Lab sequence at MSU Denver. This experiment is divided into three parts.The standardization of sodium hydroxide and hydrochloric acidDetermining the alkalinity of a control and unknown sampleDetermining the total cation content of a control and unknown sample Students will master titrations by performing them until the required accuracy and precision tolerances are met. A spreadsheet is used to calculate these values. Then students will bring in a water sample from home to determine its alkalinity and total cation content. For these two parts students will perform a potentiometric analysis and learn to use a pH meter.

Subject:
Chemistry
Material Type:
Activity/Lab
Homework/Assignment
Author:
Alycia Palmer
Date Added:
02/15/2024
Weak Acid Equilibrium
Conditional Remix & Share Permitted
CC BY-NC-SA
Rating
0.0 stars

Students are asked to calculate the pH of a weak acid aqueous solution. The problems involve a series of generic acids with assigned equilibrium constants (Ka) and total concentrations (Ct). Initially, students are required to hand calculate all problems by algebraic manipulation of the mathematical relationships of the system. The solution is a cubic equation. Through a series of assumptions, the solution is simplified. The assumptions are based on the chemistry of the system given the Ka and Ct for the problem. The problems are then graphically solved. Ultimately, the students develop an Excel worksheet to solve the problems and a Bjerrum plot to display the speciation as a function of pH.

(Note: this resource was added to OER Commons as part of a batch upload of over 2,200 records. If you notice an issue with the quality of the metadata, please let us know by using the 'report' button and we will flag it for consideration.)
Subject:
Biology
Chemistry
Life Science
Physical Science
Material Type:
Activity/Lab
Provider:
Science Education Resource Center (SERC) at Carleton College
Provider Set:
Teach the Earth
Author:
Michael Stapleton
Date Added:
08/06/2019
Weathering of Igneous, Metamorphic, and Sedimentary Rocks in a Semi-Arid Climate - An Engineering Application of Petrology
Conditional Remix & Share Permitted
CC BY-NC-SA
Rating
0.0 stars

The identification of clay mineral assemblages in soils provides a unique opportunity to demonstrate how basic principles of petrology and geochemistry are applied to engineering design criteria in construction site preparation. Specifically, the problem investigates the conditions leading to the formation of smectite in soils and the resulting construction risk due to soil expansion. Students examine soils developed on igneous, metamorphic, and sedimentary rocks near Denver, Colorado. The field locations are areas of suburban growth and several have expansive soil problems. The 2-week exercise includes sample collection, description, and preparation, determining clay mineralogy by XRD, and measurement of Atterberg Plasticity Indices. This problem develops skills in X-ray diffraction analysis as applied to clay mineralogy, reinforces leacture material on the geochemistry of weathering, and demonstrates the role of petrologic characterization in site engineering.

(Note: this resource was added to OER Commons as part of a batch upload of over 2,200 records. If you notice an issue with the quality of the metadata, please let us know by using the 'report' button and we will flag it for consideration.)
Subject:
Biology
Business and Communication
Chemistry
Communication
Composition and Rhetoric
English Language Arts
Life Science
Mathematics
Measurement and Data
Physical Science
Material Type:
Activity/Lab
Homework/Assignment
Provider:
Science Education Resource Center (SERC) at Carleton College
Provider Set:
Teach the Earth
Author:
Ric Wendlandt
Wendy Harrison
Date Added:
09/08/2020
What Goes into Making Volcanic Arc Magmas, and How Do We Know It?
Conditional Remix & Share Permitted
CC BY-NC-SA
Rating
0.0 stars

This activity is a directed reading exercise focused on papers that have been key to our understanding of the major source contributors to subduction zone volcanic rocks.

(Note: this resource was added to OER Commons as part of a batch upload of over 2,200 records. If you notice an issue with the quality of the metadata, please let us know by using the 'report' button and we will flag it for consideration.)
Subject:
Biology
Chemistry
Geoscience
Life Science
Physical Science
Material Type:
Activity/Lab
Provider:
Science Education Resource Center (SERC) at Carleton College
Provider Set:
Teach the Earth
Author:
Jeff Ryan
Date Added:
04/18/2022
What can zircons tell us about the Early Earth?
Conditional Remix & Share Permitted
CC BY-NC-SA
Rating
0.0 stars

A detailed two page Word document with activity instructions that can be tailored prior to handout. (Microsoft Word PRIVATE FILE 34kB Jun7 07)

Give students a synthetic data set (Excel PRIVATE FILE 38kB Jun7 07) of 206Pb/238U and 207Pb/235U isotope ratios. The data set will define two age populations (A and B) that can be assigned to either of the following scenarios. The data set is given to the students with the intention that Historical Geology level students will not be required to have advanced knowledge.

PART I: Data plotting
Students are to make concordia plots for use with the provided data sets (Excel PRIVATE FILE 38kB Jun7 07) using the plotting program Excel.

PART II: Data analysis
Data analysis. Experience the discovery of finding two age populations on a concordia plot. Discuss U-Pb concordance. Distinguish different populations using concordia diagram, discuss uncertainty in data.

PART III: Contextual basis
Introduce the two different scenarios (see below) for encountering the age populations A and B. Explore the implications of finding two different age populations within single grains from zircons in an igneous rock (i.e. zircon inheritance).
Explore the ability to discriminate different sedimentary components within a detrital population.
Explore what other aspects of zircon could be used to distinguish different age populations.

Question: What are you really dating when you analyze a zircon?

Two examples of the concept of multiple age populations:

Example 1: Discuss concept that zircons from an igneous rock can record multiple age populations (A and B) that result in grains with different age cores and rims. As a 'hook', illustrate this concept with images of well-known Early Earth examples, demonstrating that this exercise is a real-world problem.

Acasta gneiss zircons (images from S. Bowring)
Investigating the Jack Hills zircons (PowerPoint PRIVATE FILE 17.1MB Apr23 07) (images from A. Cavosie)
Wyoming province zircons (PowerPoint PRIVATE FILE 965kB Jun8 07) (images from D. Henry)

Example 2: Discuss concept of using zircon geochronology for sedimentary provenance. Use, as an example, two age populations (A and B, same data set as in ex. 1) of rounded detrital igneous zircons that end up in the same sedimentary rock. As a 'hook', illustrate this concept with images of well-known Early Earth examples

Field shots of Jack Hills siliciclastic sediments (images from A. Cavosie)
Field shots of Wyoming siliciclastic sediments (See #2 just above.)
Petrographic images (CL, BSE, TL, etc.) of the above.
Demonstrate that both Jack Hills and Wyoming zircons occur in siliciclastic rocks but are very different.

(Note: this resource was added to OER Commons as part of a batch upload of over 2,200 records. If you notice an issue with the quality of the metadata, please let us know by using the 'report' button and we will flag it for consideration.)
Subject:
Biology
Chemistry
Geology
Life Science
Mathematics
Measurement and Data
Physical Science
Statistics and Probability
Material Type:
Activity/Lab
Provider:
Science Education Resource Center (SERC) at Carleton College
Provider Set:
Teach the Earth
Author:
Aaron Cavosie
Darrell Henry
Julie Baldwin
Date Added:
12/26/2020
What is the True Cost of Burning Coal?
Conditional Remix & Share Permitted
CC BY-NC-SA
Rating
0.0 stars

This activity is a framework for general chemistry students to explore the costs, ethics and alternatives to coal-fired electricity.

(Note: this resource was added to OER Commons as part of a batch upload of over 2,200 records. If you notice an issue with the quality of the metadata, please let us know by using the 'report' button and we will flag it for consideration.)
Subject:
Applied Science
Biology
Career and Technical Education
Chemistry
Economics
Environmental Science
Environmental Studies
Life Science
Physical Science
Social Science
Material Type:
Activity/Lab
Provider:
Science Education Resource Center (SERC) at Carleton College
Provider Set:
Teach the Earth
Author:
Justin C. Lytle, Pacific Lutheran University
Date Added:
07/06/2017
Wheel of Geology
Conditional Remix & Share Permitted
CC BY-NC-SA
Rating
0.0 stars

This quiz game is intended to help students review for an upcoming exam. Topics of questions are randomly determined by spinning a wheel. Teams answer questions using electronic CPS handhelds.

(Note: this resource was added to OER Commons as part of a batch upload of over 2,200 records. If you notice an issue with the quality of the metadata, please let us know by using the 'report' button and we will flag it for consideration.)
Subject:
Biology
Chemistry
Geoscience
Life Science
Oceanography
Physical Science
Space Science
Material Type:
Activity/Lab
Assessment
Provider:
Science Education Resource Center (SERC) at Carleton College
Provider Set:
Teach the Earth
Author:
Rebecca Teed
Date Added:
09/28/2022
When and How Did Continental Crust Form?
Conditional Remix & Share Permitted
CC BY-NC-SA
Rating
0.0 stars

Given the extensive literature on the composition and evolution of continental crust there are a number of teaching strategies that can be employed to encourage active learning by students. A critical reading of this collection of articles will provide students with a good opportunity to evaluate the chemical isotopic and physical evidence that has led to the development of these models of continental crustal growth. These instructional approaches build on recommendations from Project 2061, Science for all Americans:
1) Start with questions about nature.
2) Engage students actively.
3) Concentrate onthe collection and use of evidence.
4) Provide historical perspectives.
5) Use a team approach.
6) Do not separate knowing from finding out.
A compilation from the primary literature has been provided (see the reference list at the end of this web page: http://serc.carleton.edu/NAGTWorkshops/earlyearth/questions/crust.html), along with guiding questions for deeper exploration and discovery. Recommended instructional methods include: jigsaw method, role playing or debates (have each student play the role of Richard Armstrong, Ross Taylor, William Fyfe...), reading the primary literature, or problem-based learning (which is purposefully ambiguous and addresses questions that require independent discovery).

(Note: this resource was added to OER Commons as part of a batch upload of over 2,200 records. If you notice an issue with the quality of the metadata, please let us know by using the 'report' button and we will flag it for consideration.)

Subject:
Biology
Chemistry
Geology
Life Science
Mathematics
Measurement and Data
Physical Science
Statistics and Probability
Material Type:
Activity/Lab
Provider:
Science Education Resource Center (SERC) at Carleton College
Provider Set:
Teach the Earth
Author:
Dave Mogk
Date Added:
09/08/2020
Where Did That Quartzite Clast Come From?: A Problem-Based Provenance Study
Conditional Remix & Share Permitted
CC BY-NC-SA
Rating
0.0 stars

For this project, students read Goetze and Lewis (1994) paper on trace element geochemistry of quartz-rich sandstones. They then select one of six possible stratigraphic units, find relevant literature related to their unit, and formulate sampling strategies. In class they are provided microprobe geochemical and cathodoluminescence data and manipulate/interpret it in order to reach conclusions. They answer questions regarding both the provenance of clasts from a young conglomerate as well as commenting on the validity of the data. Students learn how to manipulate and analyze data, how to make a scientific poster, and how to prepare and give an oral presentation

(Note: this resource was added to OER Commons as part of a batch upload of over 2,200 records. If you notice an issue with the quality of the metadata, please let us know by using the 'report' button and we will flag it for consideration.)
Subject:
Biology
Chemistry
Life Science
Physical Science
Material Type:
Activity/Lab
Homework/Assignment
Provider:
Science Education Resource Center (SERC) at Carleton College
Provider Set:
Teach the Earth
Author:
Andrew Hanson
Date Added:
08/27/2019
Who Polluted Surface and Groundwater in This Place?
Conditional Remix & Share Permitted
CC BY-NC-SA
Rating
0.0 stars

Students are provided with a 3D perspective of a virtual place, descriptions of geologic and cultural aspects, and a table with water-table elevations in groundwater and contaminant levels in water wells, springs, and rivers. Students use these data to contour water-table elevations, determine the direction of groundwater flow, and identify industrial sites that are likely sources of contamination. They then propose a remediation plan and identify water wells that are likely to remain uncontaminated in the future.

(Note: this resource was added to OER Commons as part of a batch upload of over 2,200 records. If you notice an issue with the quality of the metadata, please let us know by using the 'report' button and we will flag it for consideration.)
Subject:
Chemistry
Hydrology
Mathematics
Measurement and Data
Physical Science
Statistics and Probability
Material Type:
Activity/Lab
Provider:
Science Education Resource Center (SERC) at Carleton College
Provider Set:
Teach the Earth
Author:
Steve Reynolds
Date Added:
09/16/2020
Why Don't I Feel Better Yet? Examining the effect of dose, time interval, and elimination rate on attaining a therapeutic drug level
Conditional Remix & Share Permitted
CC BY-NC-SA
Rating
0.0 stars

Spreadsheets across the Curriculum module. Students use a spreadsheet to build a two-way table of drug level vs. time and elimination rate with parameters dosage interval and amount.

Subject:
Chemistry
Life Science
Mathematics
Physical Science
Material Type:
Activity/Lab
Provider:
Science Education Resource Center (SERC) at Carleton College
Provider Set:
Pedagogy in Action
Author:
Cheryl Coolidge
Date Added:
11/06/2014
The Woodlark Basin as a Natural Laboratory for the Study of the Geological Sciences
Conditional Remix & Share Permitted
CC BY-NC-SA
Rating
0.0 stars

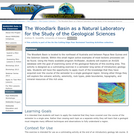
This activity guides the students through a set of geological problems related to the Woodlark Basin, Papua New Guinea.

(Note: this resource was added to OER Commons as part of a batch upload of over 2,200 records. If you notice an issue with the quality of the metadata, please let us know by using the 'report' button and we will flag it for consideration.)
Subject:
Biology
Chemistry
Geoscience
Life Science
Physical Science
Material Type:
Activity/Lab
Data Set
Lesson Plan
Provider:
Science Education Resource Center (SERC) at Carleton College
Provider Set:
Teach the Earth
Author:
Andrew Goodliffe
Date Added:
08/06/2019
Working with Electron Microprobe Data from a High Pressure Experiment - Calculating Mineral Formulas, Unit Cell Content, and Geothermometry
Conditional Remix & Share Permitted
CC BY-NC-SA
Rating
0.0 stars

This exercise provides students the opportunity to work with real microprobe data to perform a series of common calculations. It also provides a brief glimpse into a high-pressure experiment. (I hope to expand this opportunity in the future via web activities...stay tuned.) The exercise can be used as a laboratory activity or a problem set. It is ideally suited for the use of a spreadsheet like Excel, but can be completed by hand. This is a great opportunity for students who are unfamiliar with spreadsheets to get their feet wet. For me, trial by fire is the best way to learn a new software program.
The exercise could be used in any undergraduate petrology or mineralogy course and assumes only a general background in mineral chemistry. The goals are for students to: 1) work with real data from an experiment, 2) learn/remind themselves of the relationship between chemistry and
crystal structure as displayed in mineral formula, 3) use a geothermometer to see how phase equilibria can be used to decipher physical properties of rocks.
The exercises include:
- Mineral formula recalculation
- Unit cell content calculation
- Calculating end-member percentage
- Plotting data on a ternary plot
- Geothermometer calculation
The exercise could easily be modified to include other "pet" analyses or questions.

(Note: this resource was added to OER Commons as part of a batch upload of over 2,200 records. If you notice an issue with the quality of the metadata, please let us know by using the 'report' button and we will flag it for consideration.)

Subject:
Biology
Chemistry
Life Science
Mathematics
Measurement and Data
Physical Science
Physics
Statistics and Probability
Material Type:
Activity/Lab
Provider:
Science Education Resource Center (SERC) at Carleton College
Provider Set:
Teach the Earth
Author:
Brandon Schwab
Date Added:
09/15/2020
Writing chemical reactions
Conditional Remix & Share Permitted
CC BY-NC-SA
Rating
0.0 stars

In this homework exercise students learn how to write balanced chemical equations describing weathering and redox reactions by hand and by using the Geochemists Workbench.

(Note: this resource was added to OER Commons as part of a batch upload of over 2,200 records. If you notice an issue with the quality of the metadata, please let us know by using the 'report' button and we will flag it for consideration.)
Subject:
Biology
Chemistry
Life Science
Physical Science
Material Type:
Activity/Lab
Provider:
Science Education Resource Center (SERC) at Carleton College
Provider Set:
Teach the Earth
Author:
John Ayers
Date Added:
06/06/2022
"ZirChron" Virtual Zircon Analysis App
Conditional Remix & Share Permitted
CC BY-NC-SA
Rating
0.0 stars

This application was developed to promote a deeper understanding of the science of geochronology, including the integration of crystal-scale relative dating principles with numerical dating via radioisotope measurements. An integral aspect of developing this understanding is practical experience with the decision-making that goes into the selection of samples for analysis, and the subsequent interpretation of the resulting isotopic ages from those samples. The U-Pb decay system in zircon is particularly amenable to this practice, as we can apply different methods -- both in situ laser ablation inductively coupled plasma mass spectrometry (LA-ICPMS) and high-precision chemical abrasion isotope dilution thermal ionization mass spectrometry (CA-IDTIMS) -- to the same crystals, and link the resulting radioisotopic ages to the textures within crystals revealed by cathodoluminescence (CL) imaging.

The application presents the student with a set of images of zircon crystals from a single sample, illustrating their internal zoning and complexities. Two modules -- LA-ICPMS and CA-IDTIMS -- are available, with the same set of crystals available for analysis in each module. The exercises are designed around the ability of the student to conduct a virtual experiment by clicking on either labeled laser ablation "spots" (in the LA-ICPMS module) or individual crystals (in the CA-IDTIMS module) to obtain a set of radioisotopic ages. These ages are illustrated in both tabular and graphical formats to allow the student to visualize the distribution of data, and assess the relative similarities and differences between ages using common statistical tools.

(Note: this resource was added to OER Commons as part of a batch upload of over 2,200 records. If you notice an issue with the quality of the metadata, please let us know by using the 'report' button and we will flag it for consideration.)
Subject:
Biology
Chemistry
Life Science
Physical Science
Material Type:
Activity/Lab
Interactive
Provider:
Science Education Resource Center (SERC) at Carleton College
Provider Set:
Teach the Earth
Author:
Mark Schmitz
Date Added:
08/21/2020