Updating search results...

Search Resources

291 Results

View
Selected filters:
  • Measurement and Data
  • College / Upper Division
Estimating Primary Production in the Oceans from Satellite Data
Conditional Remix & Share Permitted
CC BY-NC-SA
Rating
0.0 stars

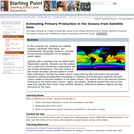
In this computer lab, students use satellite imagery, daylength information, and phytoplankton physiology models to calculate annual primary production for an assigned ocean region.

Satellite data is obtained from the NASA Earth Observation website. Students use the analysis tool to determine chlorophyll concentration and sea surface temperature. They also receive a day-length calculator and are asked to model light transmission through the water column. Using step-by-step instructions and proviede equations relating phytoplankton physiology to irradiance and temperature students calculate carbon uptake at discreet locations in the water column. The second half of the exercise involves scaling up to the entire water column, region, and season. Students present their work to the class and evaluate their result using scientific literature. Differences between regions are then discussed by the class.

(Note: this resource was added to OER Commons as part of a batch upload of over 2,200 records. If you notice an issue with the quality of the metadata, please let us know by using the 'report' button and we will flag it for consideration.)

Subject:
Biology
Chemistry
Geoscience
Life Science
Mathematics
Measurement and Data
Oceanography
Physical Science
Material Type:
Activity/Lab
Data Set
Lesson Plan
Provider:
Science Education Resource Center (SERC) at Carleton College
Provider Set:
Teach the Earth
Author:
Kevin Arrigo
Lindsey Kropuenske
Richa
Date Added:
06/16/2022
Evolution of Normal Fault Systems During Progressive Deformation
Conditional Remix & Share Permitted
CC BY-NC-SA
Rating
0.0 stars

Many papers by Ken McClay and colleagues have established the value of scale-model experiments in understanding the evolution and geometries of extensional fault systems (e.g. T. Dooley and K.R. McClay, 1997, Analogue modeling of pull-apart basins: American Association of Petroleum Geologists Bulletin, v. 81, no.11, p. 1804 -- 1826).

There are few resources available that help students visualize the dynamic nature of faulting, especially the complex interplay of faults during growth and evolution of a fault system. Such an understanding is critical, however, if students are to think meaningfully about fault geometries and what they imply.

Conducting scale-model experiments in a class setting is useful, but very time-consuming, difficult for all students to see well, and very temporary, except for the end product. Accordingly, taking a cue from a movie produced by Ken McClay, I constructed a deformation apparatus, conducted and filmed several experiments conducted by McClay, and then produced QuickTime movies of the experiments. This approach makes it possible for students to observe an experiment in a minute or two that took 30-45 minutes to produce and to view the experiment repeatedly, so as to become very familiar with all that is taking place.

Individual frames from the movie provide a template on which students can identify the sequence of fault development, rotation of features, and cessation of motion on some faults as they become inactive. Requiring students to document their observations, establish a chronological sequence of events, and explain in writing what happens during the experiment results in an increased awareness of the faulting process.

(Note: this resource was added to OER Commons as part of a batch upload of over 2,200 records. If you notice an issue with the quality of the metadata, please let us know by using the 'report' button and we will flag it for consideration.)

Subject:
Biology
Life Science
Mathematics
Measurement and Data
Statistics and Probability
Material Type:
Activity/Lab
Provider:
Science Education Resource Center (SERC) at Carleton College
Provider Set:
Teach the Earth
Author:
Bob Burger
Date Added:
09/10/2020
Explore Real Data from an Ice Core
Conditional Remix & Share Permitted
CC BY-NC-SA
Rating
0.0 stars

Ice core data allow students to explore a number of patterns while learning that researchers need to gather and interpret evidence to understand Earth's past. Students will explore core data collected in Western Greenland that document a few decades of Earth's atmosphere. Students are challenged to identify patterns and then use those patterns and background information to answer a few key questions. The data include measurements of temperature, dust, and atmospheric gases.
Downloadable files are provided for those who intend to run the activity in person. For those running the activity with an online or virtual class, a separate page includes all of the necessary information for students to complete the activity, including an interactive graph and background readings. Support videos are provided.

Subject:
Applied Science
Environmental Science
Mathematics
Measurement and Data
Physical Geography
Physical Science
Material Type:
Activity/Lab
Provider:
Science Education Resource Center (SERC) at Carleton College
Provider Set:
Teach the Earth
Author:
Jason Cervenec
Stacy Porter
Date Added:
01/20/2023
Exploring fold and thrust belts in Google Earth
Conditional Remix & Share Permitted
CC BY-NC-SA
Rating
0.0 stars

Google Earth enhances traditional geologic maps by allowing the viewer to explore three-dimensional map patterns and the interaction between structure and topography in dictating those map patterns. This activity overlays 4, 7.5' USGS quadrangles on Google Earth terrain and imagery data and encourages students to investigate common features of fold-and-thrust belts.

Keywords: Google Earth, fold-and-thrust belt, visualization

(Note: this resource was added to OER Commons as part of a batch upload of over 2,200 records. If you notice an issue with the quality of the metadata, please let us know by using the 'report' button and we will flag it for consideration.)

Subject:
Biology
Life Science
Mathematics
Measurement and Data
Material Type:
Activity/Lab
Provider:
Science Education Resource Center (SERC) at Carleton College
Provider Set:
Teach the Earth
Author:
Jack Loveless
Date Added:
09/01/2019
Faulty visualizations
Conditional Remix & Share Permitted
CC BY-NC-SA
Rating
0.0 stars

This activity utilized Visible Geology and Google Earth to help students understand the limitations of using map-view observations of layer offset to interpret types of faulting. Students create and evaluate three fault models in Visible Geology, and compare their results to actual fault offset patterns seen near Las Vegas Bay, NV.

(Note: this resource was added to OER Commons as part of a batch upload of over 2,200 records. If you notice an issue with the quality of the metadata, please let us know by using the 'report' button and we will flag it for consideration.)

Subject:
Biology
Life Science
Mathematics
Measurement and Data
Material Type:
Activity/Lab
Provider:
Science Education Resource Center (SERC) at Carleton College
Provider Set:
Teach the Earth
Author:
Martha Growdon
Date Added:
09/01/2019
The Floating Lithosphere - Cross Section of North America
Conditional Remix & Share Permitted
CC BY-NC-SA
Rating
0.0 stars

In this module, students calculate the pressure at the depth of compensation along a cross section of North America.

(Note: this resource was added to OER Commons as part of a batch upload of over 2,200 records. If you notice an issue with the quality of the metadata, please let us know by using the 'report' button and we will flag it for consideration.)

Subject:
Biology
Geology
Geoscience
Life Science
Mathematics
Measurement and Data
Physical Science
Statistics and Probability
Material Type:
Activity/Lab
Provider:
Science Education Resource Center (SERC) at Carleton College
Provider Set:
Teach the Earth
Author:
Len Vacher
Date Added:
09/05/2019
The Floating Lithosphere - Eureka!
Conditional Remix & Share Permitted
CC BY-NC-SA
Rating
0.0 stars

In this module, students examine Archimede's Principle in general and as it applies to Isostacy.

(Note: this resource was added to OER Commons as part of a batch upload of over 2,200 records. If you notice an issue with the quality of the metadata, please let us know by using the 'report' button and we will flag it for consideration.)

Subject:
Biology
Geoscience
Life Science
Mathematics
Measurement and Data
Physical Science
Physics
Statistics and Probability
Material Type:
Activity/Lab
Provider:
Science Education Resource Center (SERC) at Carleton College
Provider Set:
Teach the Earth
Author:
Len Vacher
Date Added:
09/05/2019
The Floating Lithosphere - Isostacy
Conditional Remix & Share Permitted
CC BY-NC-SA
Rating
0.0 stars

Students are asked to numerically and then analytically determine the relations governing the depth of compensation.

(Note: this resource was added to OER Commons as part of a batch upload of over 2,200 records. If you notice an issue with the quality of the metadata, please let us know by using the 'report' button and we will flag it for consideration.)

Subject:
Biology
Geoscience
Life Science
Mathematics
Measurement and Data
Physical Science
Physics
Statistics and Probability
Material Type:
Activity/Lab
Provider:
Science Education Resource Center (SERC) at Carleton College
Provider Set:
Teach the Earth
Author:
Len Vacher
Date Added:
09/04/2019
The Floating Lithosphere - Isostacy
Conditional Remix & Share Permitted
CC BY-NC-SA
Rating
0.0 stars

Students are asked to numerically and then analytically determine the relations governing the depth of compensation.

(Note: this resource was added to OER Commons as part of a batch upload of over 2,200 records. If you notice an issue with the quality of the metadata, please let us know by using the 'report' button and we will flag it for consideration.)

Subject:
Biology
Geoscience
Life Science
Mathematics
Measurement and Data
Physical Science
Physics
Statistics and Probability
Material Type:
Activity/Lab
Provider:
Science Education Resource Center (SERC) at Carleton College
Provider Set:
Teach the Earth
Author:
Len Vacher
Date Added:
09/24/2022
Flood Frequency Analysis
Conditional Remix & Share Permitted
CC BY-NC-SA
Rating
0.0 stars

This assignment asks students to do a flood frequency analysis to determine the size and stage of various floods and determine if the town of Crawford, OH is likely to be flooded or not. Outcomes: learn to work with quantitative data, learn to use Excel, be able to use USGS data.

(Note: this resource was added to OER Commons as part of a batch upload of over 2,200 records. If you notice an issue with the quality of the metadata, please let us know by using the 'report' button and we will flag it for consideration.)

Subject:
Biology
Career and Technical Education
Environmental Studies
Geology
Life Science
Mathematics
Measurement and Data
Physical Science
Statistics and Probability
Material Type:
Activity/Lab
Provider:
Science Education Resource Center (SERC) at Carleton College
Provider Set:
Teach the Earth
Author:
Sheila Roberts
Date Added:
08/16/2019
Flow of Andesite Lava
Conditional Remix & Share Permitted
CC BY-NC-SA
Rating
0.0 stars

The purpose of the exercise is to familiarize igneous petrology students with flow properties of lava, especially viscosity, and to have them consider effects on viscosity due to temperature, crystallinity and volatile content. The problem uses data from an actual eruption.

(Note: this resource was added to OER Commons as part of a batch upload of over 2,200 records. If you notice an issue with the quality of the metadata, please let us know by using the 'report' button and we will flag it for consideration.)

Subject:
Biology
Life Science
Mathematics
Measurement and Data
Statistics and Probability
Material Type:
Activity/Lab
Data Set
Lesson Plan
Provider:
Science Education Resource Center (SERC) at Carleton College
Provider Set:
Teach the Earth
Author:
Barbara Nash
Date Added:
09/05/2019
Flume Hydraulics and Sediment Transport Lab
Conditional Remix & Share Permitted
CC BY-NC-SA
Rating
0.0 stars

This exercise is intended to help link the observations of water and sediment
motion that student made in the laboratory flume with the theory discussed in
lecture. Students use the measurements made to ask some basic questions about what happened in the flume as the discharge was varied by a factor of two.
Designed for a geomorphology course

(Note: this resource was added to OER Commons as part of a batch upload of over 2,200 records. If you notice an issue with the quality of the metadata, please let us know by using the 'report' button and we will flag it for consideration.)

Subject:
Biology
Life Science
Mathematics
Measurement and Data
Statistics and Probability
Material Type:
Activity/Lab
Homework/Assignment
Provider:
Science Education Resource Center (SERC) at Carleton College
Provider Set:
Teach the Earth
Author:
Leonard Sklar
Date Added:
08/22/2019
Food Rheology; Folding Fun
Conditional Remix & Share Permitted
CC BY-NC-SA
Rating
0.0 stars

In this activity students analyze the rheologic and structural properties of various foods (everything from pudding to white bread) and think about how they expect them to behave under lateral pressure and how they will affect each other. They design experiments, run the experiments and then do lab write-ups. Depending on your emphasis, you can use this to help teach folding mechanics, rheology, why beds deform the way they do, decollements (pudding works great), deformation mechanisms, folding and even more. It is a single lecture activity, though the lead-in lecture and activity and clean-up take about 40-50 minutes.

(Note: this resource was added to OER Commons as part of a batch upload of over 2,200 records. If you notice an issue with the quality of the metadata, please let us know by using the 'report' button and we will flag it for consideration.)

Subject:
Biology
Life Science
Mathematics
Measurement and Data
Statistics and Probability
Material Type:
Activity/Lab
Provider:
Science Education Resource Center (SERC) at Carleton College
Provider Set:
Teach the Earth
Author:
Erin Beutel
Date Added:
09/01/2019
Forest Management and the Carbon Cycle
Conditional Remix & Share Permitted
CC BY-NC-SA
Rating
0.0 stars

Students begin this activity by using the IPCC4, carbon diagram to distinguish natural and anthropogenic carbon. (A point that students may need to have clarified is that CO2 from natural and anthropogenic sources is the same molecule.). Students begin with Activity 1 , calculating the overall carbon transfer for a year, followed by an examination of the role of forests in the carbon cycle. This suite of activities includes 7 parts, and the selection of additional activities depends upon the discretion of the instructor and focus of the class.

(Note: this resource was added to OER Commons as part of a batch upload of over 2,200 records. If you notice an issue with the quality of the metadata, please let us know by using the 'report' button and we will flag it for consideration.)

Subject:
Agriculture
Applied Science
Biology
Career and Technical Education
Chemistry
Environmental Science
Life Science
Mathematics
Measurement and Data
Physical Science
Statistics and Probability
Material Type:
Activity/Lab
Provider:
Science Education Resource Center (SERC) at Carleton College
Provider Set:
Teach the Earth
Author:
Sarah Brylinsky
Date Added:
08/06/2022
Foundations of Biomedical Science: Quantitative Literacy: Theory and Problems
Conditional Remix & Share Permitted
CC BY-NC-SA
Rating
0.0 stars

Foundations of Biomedical Science: Quantitative Literacy Theory and Problems is designed to help students develop the fundamental mathematical and quantitative literacy required to navigate and interpret evidence-based Biomedical data. This will provide students with the skills and confidence to habitually question any quantitative data they come across and to use these skills to make informed judgements regarding their veracity.

Subject:
Applied Science
Health, Medicine and Nursing
Mathematics
Measurement and Data
Material Type:
Textbook
Provider:
La Trobe University
Date Added:
05/17/2023
From Ocean Topography to Flexural Rigidity
Conditional Remix & Share Permitted
CC BY-NC-SA
Rating
0.0 stars

Students will use the available bathymetric datasets to test the utility of a flexural rigidity model of oceanic crust.

(Note: this resource was added to OER Commons as part of a batch upload of over 2,200 records. If you notice an issue with the quality of the metadata, please let us know by using the 'report' button and we will flag it for consideration.)

Subject:
Biology
Geoscience
Life Science
Mathematics
Measurement and Data
Physical Science
Physics
Statistics and Probability
Material Type:
Activity/Lab
Provider:
Science Education Resource Center (SERC) at Carleton College
Provider Set:
Teach the Earth
Author:
Andrew Newman
Date Added:
04/06/2022
GIS Analysis of Shoreline Change Using the Digital Shoreline Analysis System (DSAS)
Conditional Remix & Share Permitted
CC BY-NC-SA
Rating
0.0 stars

The Digital Shoreline Analysis System (DSAS) is a software extension for ArcGIS that allows for automated shoreline change calculations along the coast. The user must supply the shoreline data and the software helps the user create measurement locations (transects) and completes the shoreline change calculations at each location. The result is a visual representation of the shoreline change along a coastline. This representation is far more useful for analysis that one overall average. Unusually high rates of erosion/accretion are easily recognized from the resulting map.
The study location is Rodanthe, NC. The data used in this exercise is the sample data provided by the USGS.

Subject:
Applied Science
Computer Science
Geology
Information Science
Mathematics
Measurement and Data
Physical Geography
Physical Science
Material Type:
Activity/Lab
Provider:
Science Education Resource Center (SERC) at Carleton College
Provider Set:
Teach the Earth
Author:
Shelley Whitmeyer
Date Added:
01/20/2023
GIS Applications in Hydrologic Processes
Conditional Remix & Share Permitted
CC BY-NC-SA
Rating
0.0 stars

Students compare traditional paper-based techniques associated with estimating areal precipitation, watershed delineation, and modeling evapotranspiration. This assignment challenges students to consider the various assumptions involved with both analog and digital analyses and highlights the strengths and weaknesses of both approaches.

Subject:
Education
Educational Technology
Mathematics
Measurement and Data
Material Type:
Activity/Lab
Homework/Assignment
Provider:
Science Education Resource Center (SERC) at Carleton College
Provider Set:
Teach the Earth
Author:
John Van Hoesen
Date Added:
01/20/2023
GIS Lab - Coordinate Systems
Conditional Remix & Share Permitted
CC BY-NC-SA
Rating
0.0 stars

This lab reinforces the concepts of using coordinate systems for pinpointing locations on Earth's surface. Students are directed to search for background information online as a way to remind them of the concepts, and as a way to help them identify resources for future background help. They follow specific directions for converting between coordinate systems using ArcGIS software. Then they compare distances on the Earth for a local area using GCS units and UTM units. The end goal is to illustrate the utility of projected coordinate systems. Finally, they extract coordinate pairs from their maps and collect GPS coordinates from the same points in order to confirm the connection between GIS and GPS.

Subject:
Education
Educational Technology
Mathematics
Measurement and Data
Material Type:
Activity/Lab
Homework/Assignment
Provider:
Science Education Resource Center (SERC) at Carleton College
Provider Set:
Teach the Earth
Author:
Margaret McMillan
Date Added:
01/20/2023
GIS-RS Final Stratigraphy Project for an Undergraduate Applied GIS Course
Conditional Remix & Share Permitted
CC BY-NC-SA
Rating
0.0 stars

This student project analyzes the Devonian Marcellus Shale in northwestern Pennsylvania for the potential for deep natural gas well development based on varying thickness and structural characteristics. The Marcellus has been successfully producing high gas volumes in well in northeastern parts of Pennsylvania, and there is presently a rapid movement to evaluate the potential production in other areas of the Commonwealth. However, there are notable environmental issues regarding the large water volumes necessary to fracture the formation to allow gas production, as well as the possibility of aquifer contamination at shallower levels.

Subject:
Education
Educational Technology
Mathematics
Measurement and Data
Material Type:
Activity/Lab
Provider:
Science Education Resource Center (SERC) at Carleton College
Provider Set:
Teach the Earth
Author:
Paul Ryberg
Date Added:
01/20/2023