The typical system of equations or inequalities problem gives the system and …
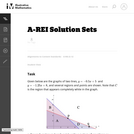
The typical system of equations or inequalities problem gives the system and asks for the graph of the solution. This task turns the problem around. It gives a solution set and asks for the system that corresponds to it. The purpose of this task is to give students a chance to go beyond the typical problem and make the connections between points in the coordinate plane and solutions to inequalities and equations. Students have to focus on what the graph is showing.
This project targets 6th grade math students. The purpose of the project …
This project targets 6th grade math students. The purpose of the project is to relate math to the real world. In particular, knowledge on graphs is used to interpret information on pollution. The project will review concepts learned such as range, domain, minimum, and maximum.
An examination of a variety of mathematical concepts which focus on solving …
An examination of a variety of mathematical concepts which focus on solving problems, interpreting data, and applications. This course includes topics such as tables, graphs, basic statistics, geometric measures, and consumer mathematics. This course fulfills the BCC mathematics requirement ONLY for the Criminal Justice, Fire Science, and Human Services programs.
This article provides ideas, lessons and resources on how elementary teachers can …
This article provides ideas, lessons and resources on how elementary teachers can integrate map skills, math, and art into lessons about the geography of the Arctic and Antarctica.
This lesson focuses on Microsoft Excel 2010. It includes YouTubes on the …
This lesson focuses on Microsoft Excel 2010. It includes YouTubes on the application's interfaces, demonstrates how to create, save, edit, insert graphics, and create and insert charts as well as user created worksheets for these skills. It concludes with a final assessment which can be used to evaluate the user's ability to use the aplication.
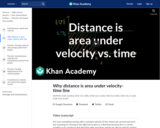
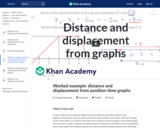
In this task students interpret two graphs that look the same but …
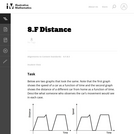
In this task students interpret two graphs that look the same but show very different quantities. The first graph gives information about how fast a car is moving while the second graph gives information about the position of the car. This problem works well to generate a class or small group discussion. Students learn that graphs tell stories and have to be interpreted by carefully thinking about the quantities shown.
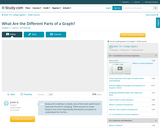
Being able to read a graph isn't just vital for an algebra …
Being able to read a graph isn't just vital for an algebra class. Graphs and charts are used everywhere! We'll take a crash course on the basic x/y plane used in algebra and give you the fundamental vocab you need. This lesson is on the different parts of a graph. Knowing the vocabulary for the different parts of the graph is really useful because it allows you to do more than just draw it on your paper and think about it in your head; it allows you to talk about it with other people and express what you're doing in words.
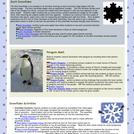
There are many possibilities for winter math data collection activities. Look for …
There are many possibilities for winter math data collection activities. Look for opportunities to have students create tally charts, clothespin graphs, Venn diagrams, bar and line graphs to organize data and analyze the results of the data collection. Build on students' natural fascination with penguins by including these math pattern activities. The Koch Snowflake is an example of an iterative drawing as each successive stage begins with the previous stage. The Koch snowflake begins with an equilateral triangle.
No restrictions on your remixing, redistributing, or making derivative works. Give credit to the author, as required.
Your remixing, redistributing, or making derivatives works comes with some restrictions, including how it is shared.
Your redistributing comes with some restrictions. Do not remix or make derivative works.
Most restrictive license type. Prohibits most uses, sharing, and any changes.
Copyrighted materials, available under Fair Use and the TEACH Act for US-based educators, or other custom arrangements. Go to the resource provider to see their individual restrictions.