In Part A of this activity, students will learn about how sea …
In Part A of this activity, students will learn about how sea ice forms and influences ocean currents around the globe. In Part B, they will look at how sea ice thickness changes over time. Finally, in Part C, students will use NSIDC sea ice index data to explore changes in sea ice extent on multiple time scales including months, years, and decades.
(Note: this resource was added to OER Commons as part of a batch upload of over 2,200 records. If you notice an issue with the quality of the metadata, please let us know by using the 'report' button and we will flag it for consideration.)
Students build a physical model to explore watershed features, then use Google …
Students build a physical model to explore watershed features, then use Google Earth software to tie the model to a real place. By exploring several layers of map-based images and data, students develop an appreciation of the complexity of a watershed and river system in the context of a both a local and national scale.
(Note: this resource was added to OER Commons as part of a batch upload of over 2,200 records. If you notice an issue with the quality of the metadata, please let us know by using the 'report' button and we will flag it for consideration.)
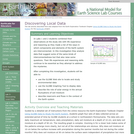
In this Lab students focus their attention on an area significantly larger …
In this Lab students focus their attention on an area significantly larger than their study site as they apply their developing knowledge of local Earth system interactions to the regional scale. Although the scale changes, the questions remain the same. How does organism or process or event "A" influence, or become changed by organism or process or event "B"? Specifically, in what ways is my local region interconnected with adjoining regions? What types of matter and energy cross the regional boundaries to help define and shape the neighboring regions? Although students will investigate the region in which they live, the concept of a "study site" changes: instead of focusing their attention on an actual plot of land, students will investigate their region by combining their personal knowledge of the region with information they can learn from Google Earth.
(Note: this resource was added to OER Commons as part of a batch upload of over 2,200 records. If you notice an issue with the quality of the metadata, please let us know by using the 'report' button and we will flag it for consideration.)
In the first part of this lab, students learn about land ice …
In the first part of this lab, students learn about land ice and the processes and timescales involved in glaciation. In Part B, they use an online interactive to explore how glaciers provide scientists with evidence for climate change. Finally, students use image processing software to measure how much area a real glacier has lost over time due to rising temperatures.
(Note: this resource was added to OER Commons as part of a batch upload of over 2,200 records. If you notice an issue with the quality of the metadata, please let us know by using the 'report' button and we will flag it for consideration.)
In this activity students develop a practical understanding of the causes and …
In this activity students develop a practical understanding of the causes and symptoms of drought. They read background articles and prepare a physical model to illustrate the role that soil moisture plays in preventing or promoting drought. Students use Google Earth to examine precipitation and streamflow data and use them to predict locations that are experiencing drought. They check their predictions by comparing them to a drought monitor map. In the final section, students examine and interpret the current map of the Palmer Drought Severity Index.
(Note: this resource was added to OER Commons as part of a batch upload of over 2,200 records. If you notice an issue with the quality of the metadata, please let us know by using the 'report' button and we will flag it for consideration.)
In Lab 5, students learned about some of the global circulation processes …
In Lab 5, students learned about some of the global circulation processes that transport both matter and energy around the planet. In Lab 6A they get a much more specific picture of the Earth system at the global scale as they investigate data collected by NASA satellites. The data is displayed in image form in the NEO (NASA Earth Observations) data visualization tool. How do the four interconnected spheres show up at the global scale in these data representations? Is it possible, from studying this data, to infer some of the same interconnections at the global scale that were identified at the local study site? What can students infer from studying changes across the seasons? In Lab 6B students play a game that focuses their attention on the global water cycle, but at the particle scale: what might happen to this molecule of water that falls onto the ground, or into a stream? Next they step back to the macroscopic scale as they diagram the ways in which water moves through the four interconnected spheres of the Earth system.
(Note: this resource was added to OER Commons as part of a batch upload of over 2,200 records. If you notice an issue with the quality of the metadata, please let us know by using the 'report' button and we will flag it for consideration.)
America's most famous drought resulted in an environmental disaster called the Dust …
America's most famous drought resulted in an environmental disaster called the Dust Bowl. From 1931 to 1939, a five-state region of the Great Plains received little rain and experienced horrendous dust storms that stripped the land of its topsoil. The event went on to shape the demographics of the American West as thousands of people migrated out of the plains and on to western states. In this activity, students will watch a PBS video and/or interact with the video's companion website. They will also examine maps and animations that show the distribution of drought patterns over the past 300 years; these maps were reconstructed from environmental records. Finally, students will examine the amount of time different areas spend in drought.
(Note: this resource was added to OER Commons as part of a batch upload of over 2,200 records. If you notice an issue with the quality of the metadata, please let us know by using the 'report' button and we will flag it for consideration.)
Students have been examining Earth as a system of interacting parts, initially …
Students have been examining Earth as a system of interacting parts, initially from the local perspective but more recently from the regional and global perspectives. In order to fully understand the Earth as a system and how its components interact with each other, students need to consider change over time. On relatively short times scales, these changes are related to the fact that the solar energy that drives the Earth system passes through an atmosphere that varies across space and time before reaching a spinning sphere. Across longer seasonal and annual time scales, these changes are more specifically related to the differential heating that results from the tilt of Earth's axis and Earth's orbit around the sun. At this longer-term global scale, it may be easier to see the repeating patterns of change across space and time and to infer how changes in one sphere may be linked to changes in others.
(Note: this resource was added to OER Commons as part of a batch upload of over 2,200 records. If you notice an issue with the quality of the metadata, please let us know by using the 'report' button and we will flag it for consideration.)
When populations live in areas where natural resources are scarce, conserving them …
When populations live in areas where natural resources are scarce, conserving them becomes critical for survival. The case study presented in this lesson introduces students to a real drought that has been developing in the Colorado River basin for many years. The Colorado River is the major source of water for people in the driest part of the United States. More than 30 million people in 7 states depend on this river as the primary source of their water. In this lesson, students discover how changes in climate over the Colorado watershed are reducing the amount of fresh water available in the river. They also see how the population of the region that uses this water has grown, resulting in increasing demands on a dwindling resource.
(Note: this resource was added to OER Commons as part of a batch upload of over 2,200 records. If you notice an issue with the quality of the metadata, please let us know by using the 'report' button and we will flag it for consideration.)
Students examine interactions and feedback between the cryosphere and atmosphere. In the …
Students examine interactions and feedback between the cryosphere and atmosphere. In the first part of this investigation, students do a hands-on activity to explore albedo and how sea ice helps regulate global temperatures.
(Note: this resource was added to OER Commons as part of a batch upload of over 2,200 records. If you notice an issue with the quality of the metadata, please let us know by using the 'report' button and we will flag it for consideration.)
In this lab, students apply the concepts of earlier lessons to their …
In this lab, students apply the concepts of earlier lessons to their own community. They begin by exploring economic, environmental, and social impacts of drought. Students then prepare for and stage a mock community meeting to draw up plans to face an upcoming drought.
(Note: this resource was added to OER Commons as part of a batch upload of over 2,200 records. If you notice an issue with the quality of the metadata, please let us know by using the 'report' button and we will flag it for consideration.)
In this activity students explore how to reduce vulnerability to drought risk …
In this activity students explore how to reduce vulnerability to drought risk through mitigation strategies. Students investigate one or more of four technology-based mitigation strategies by reading articles or viewing short podcasts and completing hands-on activities. Students make a presentation or poster to communicate their findings to the class.
(Note: this resource was added to OER Commons as part of a batch upload of over 2,200 records. If you notice an issue with the quality of the metadata, please let us know by using the 'report' button and we will flag it for consideration.)
Students explore issues related to the rapid intensification of hurricanes. They become …
Students explore issues related to the rapid intensification of hurricanes. They become familiar with the concepts of heat energy and the specific heat of water and interact with animations of sea surface temperature images to identify the Gulf Stream and the Loop Current. Students use NOAA View and Google Earth, free data-image tools, to explore visualizations of heat content in the Gulf of Mexico just before Hurricane Katrina. The examine a plotted path of Katrina as an overlay on these visualizations and observe changes in the heat content of Gulf waters as the hurricane passed over it.
(Note: this resource was added to OER Commons as part of a batch upload of over 2,200 records. If you notice an issue with the quality of the metadata, please let us know by using the 'report' button and we will flag it for consideration.)
Students extract streams and watersheds from a DEM for the island of …
Students extract streams and watersheds from a DEM for the island of Hawai'i. They then look to seeif there is a correlation between precipitation and the way a stream network develops on a mountain. Students also investigate if this is related to vegetation, soil type, and slope.
This textbook is a comprehensive lab manual for the core curriculum Introductory …
This textbook is a comprehensive lab manual for the core curriculum Introductory Geosciences classes with both informational content and laboratory exercises. Topics include basic laws and theories in Geology, the Earth's interior and plate tectonics, water and climate change, igneous rocks and volcanoes, and earthquakes.
Students use a small stream table in groups to investigate how channel …
Students use a small stream table in groups to investigate how channel form determines the shape of the hydrograph (including lag to peak). They use three channels: no channel (just sediment filling the table), a "concrete" channel (straight, no sediment on bottom), and a meandering channel. All channels get the same water input and students measure the amount of water that comes out to make a hydrograph. This gives students a chance to model a flood pulse moving through different channels to see how anthropogenic changes to rivers, such as channelizing them, alters flood hydrology. It specifically models an outburst flood from a dam release or burst, but is basically modeling any pulse of water moving through a system.
This activity is an on-line research activity in which students research different …
This activity is an on-line research activity in which students research different Minnesota lakes and determine their physical characteristics, chemical characteristics, and the overall health of the lake.
Stratified lakes exhibit vertical gradients in organisms, nutrients, and oxygen, which have …
Stratified lakes exhibit vertical gradients in organisms, nutrients, and oxygen, which have important implications for ecosystem structure and functioning. Mixing disrupts these gradients by redistributing these materials throughout the water column. Consequently, it is critical to understand the drivers of lake mixing and thermal stratification, especially because of the sensitivity of lake thermal conditions to altered climate. In this module, students will explore spatial and temporal patterns of lake mixing using high-frequency temperature data from lakes around the world. They will also explore how increases in air temperature affect thermal stratification by interpreting output from a lake model. Project EDDIE modules are designed with an A-B-C structure to make them flexible and adaptable to a range of student levels and course structures.
(Note: this resource was added to OER Commons as part of a batch upload of over 2,200 records. If you notice an issue with the quality of the metadata, please let us know by using the 'report' button and we will flag it for consideration.)
This module was initially developed by Carey, C.C., J.L. Klug, and R.L. Fuller. 1 August 2015. Project EDDIE: Dynamics of Lake Mixing. Project EDDIE Module 3, Version 1. cemast.illinoisstate.edu/data-for-students/modules/lake-mixing.shtml. Module development was supported by NSF DEB 1245707.
This lab exercise is intended to introduce students to the fundamentals of …
This lab exercise is intended to introduce students to the fundamentals of GIS as part of two - three hour lab periods. The exercise provides experience with GIS software as part of a spatial analysis exercise. Students map water quality data and compare these results with land use within the Androscoggin River Watershed.
(Note: this resource was added to OER Commons as part of a batch upload of over 2,200 records. If you notice an issue with the quality of the metadata, please let us know by using the 'report' button and we will flag it for consideration.)
This reading seminar examines land, water, food, and climate in a changing …
This reading seminar examines land, water, food, and climate in a changing world, with an emphasis on key scientific questions about the connections between natural resources and food production. Students read and discuss papers on a range of topics, including water and land resources, climate change, demography, agroecology, biotechnology, trade, and food security. The readings are supplemented by short lectures that provide context and summarize main points. The seminar provides a broad perspective on one of the defining global issues of this century. Students consider scientific controversies as well as areas of general agreement and examine practical solutions for addressing critical problems.
No restrictions on your remixing, redistributing, or making derivative works. Give credit to the author, as required.
Your remixing, redistributing, or making derivatives works comes with some restrictions, including how it is shared.
Your redistributing comes with some restrictions. Do not remix or make derivative works.
Most restrictive license type. Prohibits most uses, sharing, and any changes.
Copyrighted materials, available under Fair Use and the TEACH Act for US-based educators, or other custom arrangements. Go to the resource provider to see their individual restrictions.