The stochastic simulation algorithm (SSA, Kinetic Monte Carlo, Gillespie algorithm) produces an …
The stochastic simulation algorithm (SSA, Kinetic Monte Carlo, Gillespie algorithm) produces an example trajectory for a particular member of a probabilistic ensemble by looping over the following steps. The current state of the system is used to determine the likelihood of each possible chemical reaction in relative comparison to the likelihoods for the other possible reactions, as well as to determine when the next reaction is expected. Pseudo-random numbers are drawn to "roll the dice" to determine exactly when the next reaction will proceed, and which kind of reaction it will happen to be.
In this project, students interpret a high-resolution image of result from an …
In this project, students interpret a high-resolution image of result from an experimental run of the Jurrasic Tank sedimentation simulator at the St. Anthony Falls Lab at the University of Minnesota. They are expected to interpret depositional environments, characterize simulated stratigraphic sections, and interpret the overall sedimentary architecture of the simulated basin. All of these observations are to put together onto a poster which is the final product of the project.
(Note: this resource was added to OER Commons as part of a batch upload of over 2,200 records. If you notice an issue with the quality of the metadata, please let us know by using the 'report' button and we will flag it for consideration.)
Look inside a resistor to see how it works. Increase the battery …
Look inside a resistor to see how it works. Increase the battery voltage to make more electrons flow though the resistor. Increase the resistance to block the flow of electrons. Watch the current and resistor temperature change.
Hunt for prey and discover the meaning of evolutionary “fitness” in this …
Hunt for prey and discover the meaning of evolutionary “fitness” in this physically active group game. In this simulation game, teams of predators equipped with genetically different “mouths” (utensils) hunt for “prey” (assorted beans). Over several “generations” of play, the fittest among the predators and prey dominate the population, modeling the evolutionary process of natural selection.
In this activity, students learn about their heart rate and different ways …
In this activity, students learn about their heart rate and different ways it can be measured. Students construct a simple measurement device using clay and a toothpick, and then use this device to measure their heart rate under different circumstances (i.e., sitting, standing and jumping). Students make predictions and record data on a worksheet.
In this 1-2 week engineering design lesson, students will design and build …
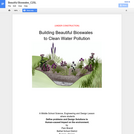
In this 1-2 week engineering design lesson, students will design and build water filters out of natural materials to simulate a filter system (bioswales) that cleans storm-water runoff before it soaks into the ground or enters a city’s storm-drain system. Their ultimate goal is to determine the combination and sequence of materials that best clean polluted water. Using materials easily found in pet stores and garden centers, students use the scientific method, students design to test and retest their designs and record, display and analyze their results.
David McCandless turns complex data sets (like worldwide military spending, media buzz, …
David McCandless turns complex data sets (like worldwide military spending, media buzz, Facebook status updates) into beautiful, simple diagrams that tease out unseen patterns and connections. Good design, he suggests, is the best way to navigate information glut -- and it may just change the way we see the world. A quiz, thought provoking question, and links for further study are provided to create a lesson around the 18-minute video. Educators may use the platform to easily "Flip" or create their own lesson for use with their students of any age or level.
To prepare for this activity, students receive background on bedforms and flow …
To prepare for this activity, students receive background on bedforms and flow regimes in class and practice identifying and classifying bedforms from field photographs. Students are then given a map of a barrier beach/inlet/tidal delta complex in mid-coast Maine and asked to predict what bedforms they expect to find in specific sub-environments. During a subsequent field trip to the area, students observe, classify and map bedforms and relate them qualitatively to formative flows. Qualitative description and classification are supplemented by quantitative measurements of bedform morphology and orientation, and by GPS-located digital photographs. After the trip, students compare their predictions and observations of bedforms in the sub-environments, reflecting on the reasons for the differences and the evolution of their thinking. The exercise also serves to set the stage for subsequent quantitative studies of bedforms and bedload transport, as well as interpretation of sedimentary structures and clastic depositional environments in the geological record.
(Note: this resource was added to OER Commons as part of a batch upload of over 2,200 records. If you notice an issue with the quality of the metadata, please let us know by using the 'report' button and we will flag it for consideration.)
Students are given the task of predicting where parasequence boundaries would exist …
Students are given the task of predicting where parasequence boundaries would exist within a vertical section of the Blackhawk Formation, Utah. This activity challenges students to apply their knowledge of bedforms in order to interpret the facies they observe. The students work in groups of two as they make their observations. The vertical section consists of four main outcrops to be observed by the students. After making their observations and interpretations of these four outcrops, the students then make predictions of what should be found up section. Students begin down section by observing the lowest section of the four outcrops. The students make observations about lithology, grain size, sedimentary structures and trace fossils. After recording their observations in their field notebook the class gathers for a discussion. Students are called on randomly to discuss what they observed. The class creates a group stratigraphic column on a white board and includes their observations to the right of the drawn profile. They are then asked to interpret what facies these observations represent. The students defend their interpretations and, as a group, agree upon an interpretation. The facies interpretation is then added to the white board and the group moves to the next outcrop up section. After observing, describing and interpreting each of the four outcrops the students are challenged to use all of the information gathered thus far to predict what facies should be observed further up section. This exercise provides an opportunity for the students to make and defend observations and interpretations. They also get a sense for the importance of Walther's Law and how it relates to sequence stratigraphy.
(Note: this resource was added to OER Commons as part of a batch upload of over 2,200 records. If you notice an issue with the quality of the metadata, please let us know by using the 'report' button and we will flag it for consideration.)
The PhET project at the University of Colorado creates "fun, interactive, research-based …
The PhET project at the University of Colorado creates "fun, interactive, research-based simulations of physical phenomena." This particular one deals with Beer's Law. "The thicker the glass, the darker the brew, the less the light that passes through." Make colorful concentrated and dilute solutions and explore how much light they absorb and transmit using a virtual spectrophotometer! The simulation is also paired with a teachers' guide and related resources from PhET. The simulation is also available in multiple languages.
In this lesson students will learn about the different types of bees, …
In this lesson students will learn about the different types of bees, the bee life cycle, and the importance of bees for our local ecosystems. Includes some background information about bees and instructions for the pollination simulation activity.
Time: 45-50 minutes
Materials: "The Honeybee Man" or other book about bees and pollination, small bag of cheetos, pip cleaners, various colors of construction paper, pompoms (small and medium), small dixie cups for water, straws (15 per group), jewerly bags, and yarn
This interactive shows the extent of the killing of lodgepole pine trees …
This interactive shows the extent of the killing of lodgepole pine trees in western Canada. The spread of pine beetle throughout British Columbia has devastated the lodgepole pine forests there. This animation shows the spread of the beetle and the increasing numbers of trees affected from 1999-2008 and predicts the spread up until 2015.
This textbook is designed for beginning learners who want to learn basic …
This textbook is designed for beginning learners who want to learn basic Japanese for the purpose of living and working in Japan. Unlike textbooks written primarily for students, whose content largely centers on student life, this book focuses more on social and professional life beyond school. As a beginning level textbook, this book includes many elementary grammar patterns (Japanese Language Proficiency Test Levels 5 and 4), but the vocabulary and situations are selected specifically for working adults. Explanations are kept concise so as to only cover key points. The main focus is on oral communication and the accompanying audio is to be used extensively. This textbook can be used for self-study, as part of an online course, or as a traditional college course.
This textbook is designed for beginning learners who want to learn basic …
This textbook is designed for beginning learners who want to learn basic Japanese for the purpose of living and working in Japan. Unlike textbooks written primarily for students, whose content largely centers on student life, this book focuses more on social and professional life beyond school.
As a beginning level textbook, this book includes many elementary grammar patterns (Japanese Language Proficiency Test Levels 5 and 4), but the vocabulary and situations are selected specifically for working adults. Explanations are kept concise so as to only cover key points. The main focus is on oral communication and the accompanying audio is to be used extensively. This textbook can be used for self-study, as part of an online course, or as a traditional college course.
This resource consists of a Java applet and expository text. The applet …
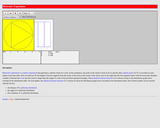
This resource consists of a Java applet and expository text. The applet is a simulation of Bertrand's experiment: a random chord on a circle The event of interest is whether the length of the chord is larger than the length of the inscribed equilateral triangle. Three models for generating the random chord can be used.
This resource consists of a Java applet and expository text. The applet …
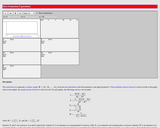
This resource consists of a Java applet and expository text. The applet simulates a random sample from a beta distribution, and computes standard point estimates of the left and right parameters. The bias and mean square error are also computed.
If you’re a coastal engineer, ecologist or planner, then this is the …
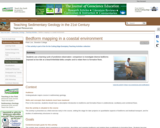
If you’re a coastal engineer, ecologist or planner, then this is the course for you. You already know that engineering and ecological principles are not enough to realize nature-friendly solutions in practice. You need people on your side!
In this course you will learn how to build a relevant coalition of stakeholders to support the design and implementation of ecosystem-based hydraulic infrastructures. After learning basic stakeholder mapping and game theory techniques, you will apply Social Design Principles to a Building with Nature ecosystem-based design case. This will equip you to identify promising collaborative arrangements for your engineering or planning practice.
The course builds on the previous Building with Nature MOOC, which explored the use of natural materials and ecological processes in achieving effective and sustainable hydraulic infrastructure designs, distilling Engineering and Ecological Design Principles. In this course, the missing element of Social Design Principles are developed and taught.
You’ll learn from renowned Dutch engineers and international environmental scientists, who work at the technical- governance interface. Iconic examples such as the Maasvlakte II expansion to Rotterdam Harbor and the Delfland Sand Engine Mega-nourishment serve as study material. The challenges in designing and implementing these nature-friendly hydraulic infrastructures are explored by the eminent professors who were responsible for their genesis.
Join us in becoming one of the new generation of engineers, ecologists and planners who see the Building with Nature integrated design approach as critical to hydraulic engineering, nature and society.
Lean thinking, as well as associated processes and tools, have involved into …
Lean thinking, as well as associated processes and tools, have involved into a ubiquitous perspective for improving systems particularly in the manufacturing arena. With application experience has come an understanding of the boundaries of lean capabilities and the benefits of getting beyond these boundaries to further improve performance. Discrete event simulation is recognized as one beyond-the-boundaries of lean technique. Thus, the fundamental goal of this text is to show how discrete event simulation can be used in addition to lean thinking to achieve greater benefits in system improvement than with lean alone. Realizing this goal requires learning the problems that simulation solves as well as the methods required to solve them. The problems that simulation solves are captured in a collection of case studies. These studies serve as metaphors for industrial problems that are commonly addressed using lean and simulation.
This set of interactive data visualizations show the weather and climate events …
This set of interactive data visualizations show the weather and climate events that have had the greatest economic impact on the US from 1980 to 2016.
No restrictions on your remixing, redistributing, or making derivative works. Give credit to the author, as required.
Your remixing, redistributing, or making derivatives works comes with some restrictions, including how it is shared.
Your redistributing comes with some restrictions. Do not remix or make derivative works.
Most restrictive license type. Prohibits most uses, sharing, and any changes.
Copyrighted materials, available under Fair Use and the TEACH Act for US-based educators, or other custom arrangements. Go to the resource provider to see their individual restrictions.