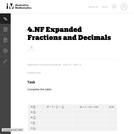
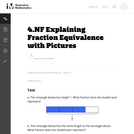
The purpose of this task is for students to show they understand …
The purpose of this task is for students to show they understand the connection between fraction and decimal notation by writing the same numbers both ways.
Using the 5E instructional model, students discover the value of using color …
Using the 5E instructional model, students discover the value of using color maps to visualize data. The activity requires students to create a color map of the ozone hole from Dobson data values derived from the Aura satellite. Students then interpret that map and compare and evaluate different color scales. Note that this is the Spanish version of Exploring Color Maps: Using Stratospheric Ozone Data.
This in class worksheet is designed to get students to think about …
This in class worksheet is designed to get students to think about and manipulate different accelerations in their head. Students work together with written descriptions of velocity and acceleration and draw the vectors in part one, and then turn that around in part two where they write descriptions of a car's motion based on the vector pictures they are given.
Through the use of the 5E instructional model, students discover the value …
Through the use of the 5E instructional model, students discover the value of using color maps to visualize data. The activity requires students to create a color map of the ozone hole from Dobson data values derived from the Aura satellite. Students then interpret that map and compare and evaluate different color scales.
This set of assignments exposes students to data which can be used …
This set of assignments exposes students to data which can be used to analyze economic inequality in international and historical context. Then students are asked to generate a thesis-driven argument drawing supporting evidence from one or more of the data sources.
This is a collection of mathematics problems relating to the moons of …
This is a collection of mathematics problems relating to the moons of the solar system. Learners will use simple proportional relationships and work with fractions to study the relative sizes of the larger moons in our solar system, and explore how temperatures change from place to place using the Celsius and Kelvin scales.
An activity in which students use dice to explore radioactive decay and …
An activity in which students use dice to explore radioactive decay and dating and make simple calculations.
(Note: this resource was added to OER Commons as part of a batch upload of over 2,200 records. If you notice an issue with the quality of the metadata, please let us know by using the 'report' button and we will flag it for consideration.)
This resource combines several OER resources in a way to help build …
This resource combines several OER resources in a way to help build deeper understanding. Students start with exploring what they already know about ratios and proportions. Next they review (or learn for the first time, depending on background) with Khan Academy some videos on the topics. They are able to do some hands on exploring with sorting ratio cards by digging into relationships. Students can then work on a three act math problem, and dig into the entire process of writing and solving a proportion problem. They end by evaluating "student work" on the topic, explaining the steps and what went wrong in the problems.
Many math classes have students with varying backgrounds and levels of understanding. These activities have multiple entry points, giving more opportunities for learning. This is designed to give students the opportunities to dig in deeply to build conceptual understanding as well as procedural fluency.
In this activity, student teams explore connections between parts of the Earth …
In this activity, student teams explore connections between parts of the Earth system, by examining a time series of environmental data maps. By examining scientific visualizations of a data pair in two time slices, they will see that the environment is the result of the interplay among many processes that take place on varying time and spatial scales. This is one of six interrelated learning activities associated with the GLOBE Earth System Poster, Exploring Connections in Year 2007, which also includes a series of assessment and extension activities. GLOBE (Global Learning and Observation to Benefit the Environment) is a worldwide, hands-on, K-12 school-based science education program.
In this activity, student teams explore connections between parts of the Earth …
In this activity, student teams explore connections between parts of the Earth system, by examining a time series of environmental data maps. Each team examines a single variable displayed on a global data map, and identify the unit of measure, the range of values, and patterns they observe in the data. Variables include: insolation, surface temperature, precipitation, cloud fraction, aerosols, biopshere. This is one of six interrelated learning activities associated with the GLOBE Earth System Poster, "Exploring Connections in Year 2007," and includes a series of assessment and extension activities. GLOBE (Global Learning and Observation to Benefit the Environment) is a worldwide, hands-on, K-12 school-based science education program.
This book introduces students to some of the most unusual places in …
This book introduces students to some of the most unusual places in our galaxy outside of our solar system. Answering the question, "How many stars are in the sky?" introduces students to basic counting, tallying, and grouping techniques, as well as allowing for the use of simple proportions.
Students will explore time series plots and raw data to understand the …
Students will explore time series plots and raw data to understand the role of sea surface temperature increases on arctic ice melt. This is part three of a four-part activity on polar science. The activity builds on the knowledge gained in Using Data and Images to Understand Albedo (part 2). Extension activities examining air and sea surface temperature in relation to changing Earth albedo are included. Information is provided on data access using the NOAA Earth System Research Laboratory Web site. This activity is one of several learning activities connected with the 2007 GLOBE Earth system poster.
As science extension activities, this book of problems introduces students to mapping …
As science extension activities, this book of problems introduces students to mapping the shape of the Milky Way galaxy, and how to identify the various kinds of galaxies in our universe. Students also learn about the shapes and sizes of other galaxies in our universe as they learn how to classify them. The math problems cover basic scientific notation skills and how they apply to working with astronomically large numbers. It also provides exercises in plotting points on a Cartesian plane to map the various features of our Milky Way.
This is an activity about the solar activity cycle. Learners will construct …
This is an activity about the solar activity cycle. Learners will construct a graph to identify a pattern of the number of observed sunspots and the number of coronal mass ejections emitted by the Sun over a fifteen year time span. A graphing calculator is recommended, but not required, for this activity. This is the second activity in the Solar Storms and You: Exploring the Wind from the Sun educator guide.
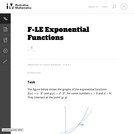
In this task students prove that linear functions grow by equal differences …
In this task students prove that linear functions grow by equal differences over equal intervals, and that exponential functions grow by equal factors over equal intervals.
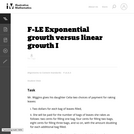
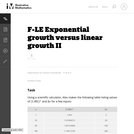
In this task students observe using graphs and tables that a quantity …
In this task students observe using graphs and tables that a quantity increasing exponentially eventually exceeds a quantity increasing linearly, quadratically, or (more generally) as a polynomial function.
No restrictions on your remixing, redistributing, or making derivative works. Give credit to the author, as required.
Your remixing, redistributing, or making derivatives works comes with some restrictions, including how it is shared.
Your redistributing comes with some restrictions. Do not remix or make derivative works.
Most restrictive license type. Prohibits most uses, sharing, and any changes.
Copyrighted materials, available under Fair Use and the TEACH Act for US-based educators, or other custom arrangements. Go to the resource provider to see their individual restrictions.