This Summary for teachers is inspired by the IPCC's Special Report on …
This Summary for teachers is inspired by the IPCC's Special Report on Climate Change and Land.
This resource is a teacher-friendly version of the Summary for Policymakers of the IPCC report. Useful infographics and ideas for short class activities are provided, as well a glossary and a list of educational resources.
This Summary for teachers is inspired by the IPCC's Special Report on …
This Summary for teachers is inspired by the IPCC's Special Report on the Ocean and Cryosphere in a Changing Climate. This resource is a teacher-friendly version of the Summary for Policymakers of the IPCC report. Useful infographics and ideas for short class activities are provided, as well a glossary and a list of educational resources.
Students access the ice core data archived at Lamont-Doherty Geological Observatory. They …
Students access the ice core data archived at Lamont-Doherty Geological Observatory. They select a core (Greenland, Antarctica, Quelcaya), pose a working hypothesis regarding the data, import the data in an Excel-readable format, and examine the data to determine correlations between variables and cause/effect as recorded in leads and lags. They generate a written and graphical analysis of the data and, in the next lab period, discuss the similarities and differences among their group outputs in terms of demonstrated correlations, assumptions required, effects of latitude, and any other item that arises.
(Note: this resource was added to OER Commons as part of a batch upload of over 2,200 records. If you notice an issue with the quality of the metadata, please let us know by using the 'report' button and we will flag it for consideration.)
This video features research conducted at University of Colorado's Institute of Arctic …
This video features research conducted at University of Colorado's Institute of Arctic and Alpine Research, which studies isotopes of hydrogen trapped in ice cores to understand climate changes in the past.
This article describes two hands-on lessons to teach elementary and middle school …
This article describes two hands-on lessons to teach elementary and middle school students about ice, glaciers, and climate change in the polar regions.
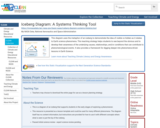
This diagram uses the metaphor of an iceberg to demonstrate the idea …
This diagram uses the metaphor of an iceberg to demonstrate the idea of visible vs hidden as it relates to Earth science phenomena. This teaching strategy helps students to see beyond the obvious and to develop their awareness of the underlying causes, relationships, and/or conditions that can contribute to phenomenological events. It also provides a framework for digging deeper into phenomena-driven lessons in Earth Science.
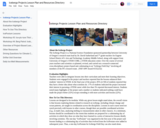
The Icebergs Project is a National Science Foundation sponsored partnership between University …
The Icebergs Project is a National Science Foundation sponsored partnership between University of Oregon’s research team lead by Dr. David Sutherland and 7th grade teachers for Eugene School District 4J’s Arts and Technology Academy Middle School, along with support from University of Oregon’s STEM CORE, a STEM education center. Over the course of several years teachers and scientists co-planned, revised, and carried out a research-connected cross-disciplinary project-based unit culminating in an “Icebergs Field Day” involving all members of the PI’s research team. Ultimately two separate week-long units were designed, with only one implemented each year.
This lesson invites young students to inquire about phase changes, about what …
This lesson invites young students to inquire about phase changes, about what happens as water changes into ice and as ice changes into water, observing ice melting and freezing under a variety of conditions.
This visualization is a collection of maps, by continent, that project the …
This visualization is a collection of maps, by continent, that project the impact on coastlines of a 216-foot rise in sea level, which is assumed to be the result of melting all the land ice on Earth.
The goal of this assignment is to introduce students to the degree …
The goal of this assignment is to introduce students to the degree to which ecosystems, climate, and geography have varied through Earth history. It requires students to work in groups (which many resist) and to research each geologic period using the Paleo Portal website and external websites.
(Note: this resource was added to OER Commons as part of a batch upload of over 2,200 records. If you notice an issue with the quality of the metadata, please let us know by using the 'report' button and we will flag it for consideration.)
In this visualization, students can explore North American fossil fuel CO2 emissions …
In this visualization, students can explore North American fossil fuel CO2 emissions at very fine resolutions of both space and time. The data is provided by the Vulcan emissions data project, a NASA/DOE funded effort under the North American Carbon Program.
This collection of photos from the NASA Climate website features images of …
This collection of photos from the NASA Climate website features images of global change, such as floods, wildfires, and retreating glaciers. Not all images show change caused directly by climate change and energy use, and descriptive captions indicate causes for change in most of the images.
The main content objectives covered in this unit are the phenomena of …
The main content objectives covered in this unit are the phenomena of global warming, carbon cycle, ocean acidification, and its impact on plants, animals, and the marine ecosystem. The main purpose of this is to provide the reader with the basic knowledge base about these processes and understand the main players that are responsible for them. Fossil fuel pollution by human activities is contributing to the increase in the amount of CO2 in the atmosphere. Some of the CO2 is being absorbed by the oceans. This process increases the number of free hydrogen ions in the oceans, making the ocean water more acidic. This phenomenon is called ocean acidification. When oceans become acidic, they can negatively affect the plants, living organisms such as shell-forming organisms, and other marine life. The results of this process are devastating and this unit hopes to bring students’ attention to these dangers.
A simple three-part diagram from UNEP GRID Vital Water Graphics showing how …
A simple three-part diagram from UNEP GRID Vital Water Graphics showing how global warming could impact coastlines and populated areas of Bangladesh with a 1 and 1.5 meter sea level rise relative to the current coastline.
This is a five-activity module that explores the evidence for and impacts …
This is a five-activity module that explores the evidence for and impacts of melting glacial ice, with resources from major institutions and scientists who study glaciers -- primarily in Arctic areas. The suite of activities includes both glaciers and melting ice, as well as the impact of melt water downstream. Each activity follows the 5E model of Engagement, Exploration, Explanation, Elaboration, and Evaluation.
In this exercise, students explore NOAA and the Climate Data Center websites …
In this exercise, students explore NOAA and the Climate Data Center websites that provide information about El NiÃo. The students are then asked interpret a series of maps to describe the key changes in climate conditions during El NiÃo and La NiÃa. Two locations of emphasized: North America and Australia to illustrate the contrast in climatic changes and allow for determination of the impacts close to home.
(Note: this resource was added to OER Commons as part of a batch upload of over 2,200 records. If you notice an issue with the quality of the metadata, please let us know by using the 'report' button and we will flag it for consideration.)
This lesson is comprised of three activities (three class periods). Students use …
This lesson is comprised of three activities (three class periods). Students use web-based animations to explore the impacts of ice melt and changes to sea level. Students are introduced to topographic maps by doing a hands-on activity to model the contours of an island. Then students examine the relationship between topography and sea level rise by mapping changing shorelines using a topographic map.
No restrictions on your remixing, redistributing, or making derivative works. Give credit to the author, as required.
Your remixing, redistributing, or making derivatives works comes with some restrictions, including how it is shared.
Your redistributing comes with some restrictions. Do not remix or make derivative works.
Most restrictive license type. Prohibits most uses, sharing, and any changes.
Copyrighted materials, available under Fair Use and the TEACH Act for US-based educators, or other custom arrangements. Go to the resource provider to see their individual restrictions.