The primary purpose of this task is to illustrate that the domain …
The primary purpose of this task is to illustrate that the domain of a function is a property of the function in a specific context and not a property of the formula that represents the function. Similarly, the range of a function arises from the domain by applying the function rule to the input values in the domain. A second purpose would be to illicit and clarify a common misconception, that the domain and range are properties of the formula that represent a function.
The material was written with review in mind, but there is enough …
The material was written with review in mind, but there is enough detail that it would be useful for new students as well. Each topic includes written introductions, detailed examples, and practice exercises that are fully keyed. In addition, each chapter concludes with additional practice problems – those problems are not keyed, although short answers are provided. Many topics also include videos.
This task assumes students have an understanding of the relationship between functions …
This task assumes students have an understanding of the relationship between functions and equations. Using this knowledge, the students are prompted to try to solve equations in order to find the inverse of a function given in equation form: when no such solution is possible, this means that the function does not have an inverse.
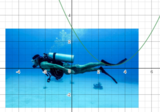
The purpose of this task is to investigate the meaning of the …
The purpose of this task is to investigate the meaning of the definition of function in a real-world context where the question of whether there is more than one output for a given input arises naturally. In more advanced courses this task could be used to investigate the question of whether a function has an inverse.
With an emphasis on teaching and learning, this book is for an …
With an emphasis on teaching and learning, this book is for an advanced undergraduate course on partial differential equations or a beginning graduate course on partial differential equations. Divided into 13 chapters, this textbook covers most of the important topics found in books on partial differential equations, using most of the time the same approach.
This book contains material on partial differential equations usually taught at the undergraduate level for science and engineering students. The reason for including this material is that many mathematics students do not have the chance to study partial differential equations at the undergraduate level. The sections covering the undergraduate material are accessible to readers with only a calculus background. The presentation in these sections is usually more formal and therefore appropriate for introducing partial differential equations for science and engineering students. This book is accessible to students with a minimal introduction to measure and integration, and functional analysis
This task is designed to get at a common student confusion between …
This task is designed to get at a common student confusion between the independent and dependent variables. This confusion often arises in situations like (b), where students are asked to solve an equation involving a function, and confuse that operation with evaluating the function.
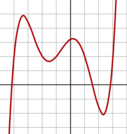
The purpose of this lesson is for students to discover the connection …
The purpose of this lesson is for students to discover the connection between the algebraic and the graphical structure of polynomial functions. This lesson leads to students being able to sketch a graph by identifying the end behavior, intercepts, and multiplicities from a given polynomial equation. It also leads to students being able to write a possible equation by determining the sign of the leading coefficient, minimum possible degree, x-intercepts and y-intercept from a given polynomial graph.
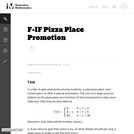
In this task students construct and compare linear and exponential functions and …
In this task students construct and compare linear and exponential functions and find where the two functions intersect. One purpose of this task is to demonstrate that exponential functions grow faster than linear functions even if the linear function has a higher initial value and even if we increase the slope of the line. This task could be used as an introduction to this idea.
In this lesson, through various examples and activities, exponential growth and polynomial …
In this lesson, through various examples and activities, exponential growth and polynomial growth are compared to develop an insight about how quickly the number can grow or decay in exponentials. A basic knowledge of scientific notation, plotting graphs and finding intersection of two functions is assumed.
This OER course using a new textbook is based a section of …
This OER course using a new textbook is based a section of MAT103 Pre-Calculus. It is a preparatory course for Calculus. It builds upon the intermediate level of Algebra and makes intensive use of technology to conceptualize functions and methods of function manipulation with emphasis on quantitative change. All course content written by Fahmil Shah. Added to OER Commons by Victoria Vidal.
This is a project that generally follows the PBL framework that can …
This is a project that generally follows the PBL framework that can be used to help students master the concept of qudratics in their study of intermediate algebra. Specifically, it was designed to help students master the concept of quadratic functions, equations, and inequalities, including the parts of both standard & vertex equations, as well as how to identify the domain & range of a quadratic function; how to apply quadratics as the square of binomials; how to make decisions about a specific quadratic problem or application relative to the significance of the vertex and roots; and how to transform a quadratic by manipulating its parent equation. Note that the project was designed and delivered per the North Carolina Math 2 curriculum and it can be customized to meet your own specific curriculum needs and resources.
In this task students are asked to analyze a function and its …
In this task students are asked to analyze a function and its inverse when the function is given as a table of values. In addition to finding values of the inverse function from the table, they also have to explain why the given function is invertible.
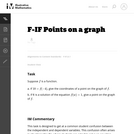
This task requires interpreting a function in a non-standard context. While the …
This task requires interpreting a function in a non-standard context. While the domain and range of this function are both numbers, the way in which the function is determined is not via a formula but by a (pre-determined) sequence of coin flips. In addition, the task provides an opportunity to compute some probabilities in a discrete situation.
The task is better suited for instruction than for assessment as it …
The task is better suited for instruction than for assessment as it provides students with a non standard setting in which to interpret the meaning of functions. Students should carry out the process of flipping a coin and modeling this Random Walk in order to develop a sense of the process before analyzing it mathematically.
This Remote Learning Plan was created by Elizabeth Hock in collaboration with Craig …
This Remote Learning Plan was created by Elizabeth Hock in collaboration with Craig Hicks and Tyler Cronin as part of the 2020 ESU-NDE Remote Learning Plan Project. Educators worked with coaches to create Remote Learning Plans as a result of the COVID-19 pandemic.The attached Remote Learning Plan is designed for 9-12 mathematics students. Students will describe the domain and range of functions and use domain and range to create possible graphs of functions. This Remote Learning Plan addresses the following NDE Standard: MA 11.2.1.d Identify domain and range of functions represented in either algebraic or graphical form.It is expected that this Remote Learning Plan will take students 50 minutes to complete. Here is the direct link to the Google Doc: https://docs.google.com/presentation/d/1aidqqyXpJ_hOISMjn_qOTXoSu8Px_OrSxZ-iCp27pcQ/view
This Remote Learning Plan was created by Elizabeth Hock in collaboration with Craig …
This Remote Learning Plan was created by Elizabeth Hock in collaboration with Craig Hicks and Tyler Cronin as part of the 2020 ESU-NDE Remote Learning Plan Project. Educators worked with coaches to create Remote Learning Plans as a result of the COVID-19 pandemic.The attached Remote Learning Plan is designed for 9-12 mathematics students. Students will use technology to graph and describe functions. This Remote Learning Plan addresses the following NDE Standard: MA 11.2.1 Algebraic Relationships: Students will demonstrate, represent, and show relationships with functions. It is expected that this Remote Learning Plan will take students 100 minutes to complete. Here is the direct link to the Google Doc: https://docs.google.com/presentation/d/1DsoE018GEbWmtkv2GaeH6WCvdnx_LpxfQ7t0xxnbBtU/view
This Remote Learning Plan was created by Elizabeth Hock in collaboration with Craig …
This Remote Learning Plan was created by Elizabeth Hock in collaboration with Craig Hicks and Tyler Cronin as part of the 2020 ESU-NDE Remote Learning Plan Project. Educators worked with coaches to create Remote Learning Plans as a result of the COVID-19 pandemic.The attached Remote Learning Plan is designed for 9-12 mathematics students.Students will find points of intersection in many ways and learn to use the Table and Calculate tools on their graphing calculators. This Remote Learning Plan addresses the following NDE Standard:MA 11.2.2.h Analyze and solve systems of two linear equations and inequalities in two variables algebraically and graphically.It is expected that this Remote Learning Plan will take students 100 minutes to complete. Here is the direct link to the Google Doc: https://docs.google.com/presentation/d/1I9Qx4kbsu31-WTxK4i-i7wTQIbkTY9jEhLstpwjokKc/view
No restrictions on your remixing, redistributing, or making derivative works. Give credit to the author, as required.
Your remixing, redistributing, or making derivatives works comes with some restrictions, including how it is shared.
Your redistributing comes with some restrictions. Do not remix or make derivative works.
Most restrictive license type. Prohibits most uses, sharing, and any changes.
Copyrighted materials, available under Fair Use and the TEACH Act for US-based educators, or other custom arrangements. Go to the resource provider to see their individual restrictions.