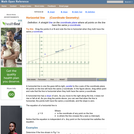
This is a booklet containing 15 problems that incorporate data and information …
This is a booklet containing 15 problems that incorporate data and information from the Hinode solar observatory. The problems involve math skills such as finding the scale of an image to determine actual physical sizes in images, time calculations, volumes of cylinders, graph analysis, and scientific notation. Learners will use mathematics to explore solar science topics such as sunspot structure, spectroscopy, solar rotation, magnetic fields, density and temperature of hot gases, and solar flares. This booklet can be found on the Space Math@NASA website.
This course focuses on one particular aspect of the history of computing: …
This course focuses on one particular aspect of the history of computing: the use of the computer as a scientific instrument. The electronic digital computer was invented to do science, and its applications range from physics to mathematics to biology to the humanities. What has been the impact of computing on the practice of science? Is the computer different from other scientific instruments? Is computer simulation a valid form of scientific experiment? Can computer models be viewed as surrogate theories? How does the computer change the way scientists approach the notions of proof, expertise, and discovery? No comprehensive history of scientific computing has yet been written. This seminar examines scientific articles, participants’ memoirs, and works by historians, sociologists, and anthropologists of science to provide multiple perspectives on the use of computers in diverse fields of physical, biological, and social sciences and the humanities. We explore how the computer transformed scientific practice, and how the culture of computing was influenced, in turn, by scientific applications.
An interactive applet and associated web page that show the definition of …
An interactive applet and associated web page that show the definition of a horizontal line in coordinate geometry. The applet has two points that the user can drag which define a line. The line flagged when it is horizontal (slope=0) and the equation of the line is shown. The grid, details and coordinates can be turned on and off. The applet can be printed exactly as it appears on the screen to make handouts. The web page has a discussion on how to test for horizontal, the line equation and has links to other pages relating to coordinate geometry. Applet can be enlarged to full screen size for use with a classroom projector. This resource is a component of the Math Open Reference Interactive Geometry textbook project at http://www.mathopenref.com.
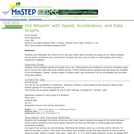
This activity is a lab investigation where students observe, record, and gather …
This activity is a lab investigation where students observe, record, and gather data on the speed, acceleration, constant speed, and average speed of toy cars. This activity allows for futher investigation of speed, time, and distance of objects to calculate speed and acceleration.
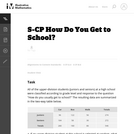
Students teams determine the size of the caverns necessary to house the …
Students teams determine the size of the caverns necessary to house the population of the state of Alabraska from the impending asteroid impact. They measure their classroom to determine area and volume, determine how many people the space could sleep, and scale this number up to accommodate all Alabraskans. They work through problems on a worksheet and perform math conversions between feet/meters and miles/kilometers.
In this classic hands-on activity, learners estimate the length of a molecule …
In this classic hands-on activity, learners estimate the length of a molecule by floating a fatty acid (oleic acid) on water. This lab asks learners to record measurements and make calculations related to volume, diameter, area, and height. Learners also convert meters into nanometers. Includes teacher and student worksheets but lacks in depth procedure information. The author suggests educators search the web for more complete lab instructions.
Calculation of a carbon footprint resulting from common breakfast choices illustrates the …
Calculation of a carbon footprint resulting from common breakfast choices illustrates the importance of contextualization.
(Note: this resource was added to OER Commons as part of a batch upload of over 2,200 records. If you notice an issue with the quality of the metadata, please let us know by using the 'report' button and we will flag it for consideration.)
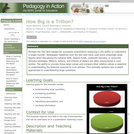
Perhaps the first skill needed for successful quantitative reasoning is the ability …
Perhaps the first skill needed for successful quantitative reasoning is the ability to understand a single number. Newspaper headlines over the last year have used some amazingly large figures when discussing the national debt, bailout funds, corporate bonuses, or economic stimulus packages. Millions, billions, and trillions of dollars are often encountered in such stories. The ability to process these large values and compare their relative values is essential in understanding the financial nuances to such articles. This example contains two in-depth approaches to understanding large quantities.
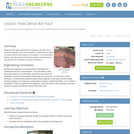
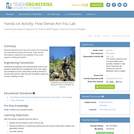
Students learn about geotechnical engineers and their use of physical properties, such …
Students learn about geotechnical engineers and their use of physical properties, such as soil density, to determine the ability of various soils to offer support to foundations. In an associated activity, students determine the bulk densities of soil samples, and assess their suitability to support foundations.
Students determine the mass and volume of soil samples and calculate the …
Students determine the mass and volume of soil samples and calculate the density of the soils. They use this information to determine the suitability of the soil to support a building foundation.
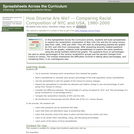
Spreadsheets Across the Curriculum module. Students analyze the percentage of change in …
Spreadsheets Across the Curriculum module. Students analyze the percentage of change in the diversity of the US compared to New York City over 20 years.
This demonstration shows that an increase in temperature will speed up the …
This demonstration shows that an increase in temperature will speed up the water cycle. One outcome will be an increase in rainfall. A second outcome will be the increase in total evaporation of water and subsequent drought. Materials required include two aquariums, plastic wrap, 2 clamp lamps with 60 watt light bulbs, pebbles and rocks, modeling clay, blue food coloring, and water. Student worksheets, background information for teachers, and a scoring rubric are included. This is Activity 2 in Too Many Blankets, a module in the lesson series, Potential Consequences of Climate Variability and Change.
SSAC Physical Volcanology module. Students build a spreadsheet to examine how magma …
SSAC Physical Volcanology module. Students build a spreadsheet to examine how magma viscosity varies with temperature, fraction of crystals, and water content using the non-Arrhenian VFT model.
SSAC Physical Volcanology module. Students build spreadsheets to estimate melt density at …
SSAC Physical Volcanology module. Students build spreadsheets to estimate melt density at high temperatures and pressures from the thermodynamic properties of silicates.
This task is designed as an assessment item. It requires students to …
This task is designed as an assessment item. It requires students to use information in a two-way table to calculate a probability and a conditional probability. Although the item is written in multiple choice format, the answer choices could be omitted to create a short-answer task.
SSAC Physical Volcanology module. Students build a spreadsheet to examine and apply …
SSAC Physical Volcanology module. Students build a spreadsheet to examine and apply the Mogi model for horizontal and vertical surface displacement vs. depth and pressure conditions in the magma chamber.
While learning about volcanoes, magma and lava flows, students learn about the …
While learning about volcanoes, magma and lava flows, students learn about the properties of liquid movement, coming to understand viscosity and other factors that increase and decrease liquid flow. They also learn about lava composition and its risk to human settlements.
Students practice their multiplication skills using robots with wheels built from LEGO® …
Students practice their multiplication skills using robots with wheels built from LEGO® MINDSTORMS® NXT kits. They brainstorm distance travelled by the robots without physically measuring distance and then apply their math skills to correctly calculate the distance and compare their guesses with physical measurements. Through this activity, students estimate parameters other than by physically measuring them, practice multiplication, develop measuring skills, and use their creativity to come up with successful solutions.
Spreadsheets Across the Curriculum module. Students use Polya's problem-solving heuristic to find …
Spreadsheets Across the Curriculum module. Students use Polya's problem-solving heuristic to find the distance of a peak using vertical angles sighted from a wagon train heading toward the peak.
Students measure the permeability of different types of soils, compare results and …
Students measure the permeability of different types of soils, compare results and realize the importance of size, voids and density in permeability response.
No restrictions on your remixing, redistributing, or making derivative works. Give credit to the author, as required.
Your remixing, redistributing, or making derivatives works comes with some restrictions, including how it is shared.
Your redistributing comes with some restrictions. Do not remix or make derivative works.
Most restrictive license type. Prohibits most uses, sharing, and any changes.
Copyrighted materials, available under Fair Use and the TEACH Act for US-based educators, or other custom arrangements. Go to the resource provider to see their individual restrictions.