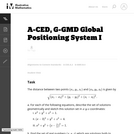
This question examines the algebraic equations for three different spheres. The intersections …
This question examines the algebraic equations for three different spheres. The intersections of each pair of spheres are then studied, both using the equations and thinking about the geometry of the spheres. For two spheres where one is not contained inside of the other there are three possibilities for how they intersect.
Game Over Gopher is an exciting tower defense game that guides students …
Game Over Gopher is an exciting tower defense game that guides students in plotting coordinate pairs, differentiating negative coordinates from positive coordinates, and identifying the four quadrants. Hungry space gophers are marching towards a prize carrot, and to defend it players place tools around the coordinate grid to “feed” gophers and make them lose interest. Ruby mines (which must be placed at designated x, y coordinates) yield currency that players spend to strategically place carrot launchers, garlic rays, corn silos, and beet traps – gopher feeding tools. To introduce students to the coordinate grid, Game Over Gopher introduces new skills via interactive tutorials and uses consistent visual clues (e.g., x red, y blue) to guide players in plotting coordinates. This means it’s not necessary to teach students coordinate plotting ahead of time. As the levels progress, the number of tools available increases, the level of math vocabulary increases, the scale of the grid changes, and players are asked to expand their mastery of the grid by reflecting points across axes. The game lowers intimidation about the coordinate grid, helps students understand how positive and negative numbers reflect each other across the axes, and helps students get comfortable with the four quadrants.
"Shadows are corrupting the land. Restore the balance of nature by exploring …
"Shadows are corrupting the land. Restore the balance of nature by exploring place value. Gate guides students in: lowering intimidation about large numbers and decimals, understanding the meaning of place value, and realizing that the same mathematical concepts that apply to the ""easy"" integers apply to every order of magnitude."
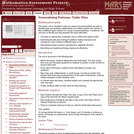
This lesson unit is intended to help teachers assess how well students …
This lesson unit is intended to help teachers assess how well students are able to identify linear and quadratic relationships in a realistic context: the number of tiles of different types that are needed for a range of square tabletops. In particular, this unit aims to identify and help students who have difficulties with: choosing an appropriate, systematic way to collect and organize data; examining the data and looking for patterns; finding invariance and covariance in the numbers of different types of tile; generalizing using numerical, geometrical or algebraic structure; and describing and explaining findings clearly and effectively.
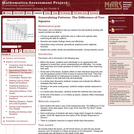
This lesson unit is intended to help you assess how well students …
This lesson unit is intended to help you assess how well students working with square numbers are able to: choose an appropriate, systematic way to collect and organize data, examining the data for patterns; describe and explain findings clearly and effectively; generalize using numerical, geometrical, graphical and/or algebraic structure; and explain why certain results are possible/impossible, moving towards a proof.
In this module, students explore and experience the utility of analyzing algebra …
In this module, students explore and experience the utility of analyzing algebra and geometry challenges through the framework of coordinates. The module opens with a modeling challenge, one that reoccurs throughout the lessons, to use coordinate geometry to program the motion of a robot that is bound within a certain polygonal region of the planethe room in which it sits. To set the stage for complex work in analytic geometry (computing coordinates of points of intersection of lines and line segments or the coordinates of points that divide given segments in specific length ratios, and so on), students will describe the region via systems of algebraic inequalities and work to constrain the robot motion along line segments within the region.
Find the rest of the EngageNY Mathematics resources at https://archive.org/details/engageny-mathematics.
Students learn about an important characteristic of lines: their slopes. Slope can …
Students learn about an important characteristic of lines: their slopes. Slope can be determined either in graphical or algebraic form. Slope can also be described as positive, negative, zero or undefined. Students get an explanation of when and how these different types of slope occur. Finally, they learn how slope relates to parallel and perpendicular lines. When two lines are parallel, they have the same slope and when they are perpendicular their slopes are negative reciprocals of one another.
In this seminar, you will learn how to graph linear equations that …
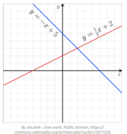
In this seminar, you will learn how to graph linear equations that have been written in any form. You will learn the characteristics of intercepts, and also of horizontal and vertical lines. You will discover the various types of information that can be discovered by looking at the graph of a linear equation.StandardsCC.2.2.HS.D.10 Represent, solve, and interpret equations/inequalities and systems of equations/inequalities algebraically and graphically
Rebecca Davis sets up a coordinate plane on the floor of her …
Rebecca Davis sets up a coordinate plane on the floor of her classroom. Groups of 3 or 4 students are assigned equations in slope-intercept form and graph them using their bodies on the giant coordinate plane. As extensions, Ms. Davis changes the slope or y-intercept of the original equation and makes the activity into a race.
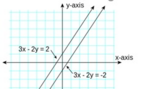
This seminar will allow you to solve a system of linear equations …
This seminar will allow you to solve a system of linear equations by graphing. It will help you to understand what it means when the lines in a system of equations are parallel, and also what it means for the graphs to be the same line. You will learn how to visually identify information about the system of equations simply by examining the graphs of the lines that make up the system.StandardsCC.2.2.HS.D.10Represent, solve, and interpret equations/inequalities and systems of equations/inequalities algebraically and graphically.
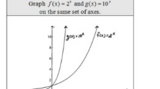
This seminar will teach you how to identify the graph of an …
This seminar will teach you how to identify the graph of an exponential function. You will learn how to identify the properties of the function that explain the shape of the graph. The seminar will also show you how to graph an exponential function that you are given. You will learn about the properties of the graphs of exponential functions and how they are related to the properties of exponents. You will be guided through examples of graphing using tables and also using properties of the functions themselves.StandardsCC.2.2.HS.D.7Create and graph equations or inequalities to describe numbers or relationships.
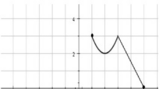
This seminar will help you to understand how the graph of a …
This seminar will help you to understand how the graph of a function relates to the function itself, and how to determine the domain and range of a function by examining its graph. It is necessary to be able to determine a function’s domain and range in order to understand how different functions are restricted by their rules. Understanding how to visually interpret functions by looking at their graphs will also allow you to quickly gather important information about the function. StandardsCC.2.2.HS.C.2 Graph and analyze functions and use their properties to make connections between the different representations.
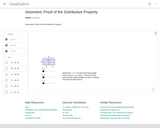
This exploration can be done in class near the beginning of a …
This exploration can be done in class near the beginning of a unit on graphing parabolas. Students need to be familiar with intercepts, and need to know what the vertex is.
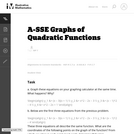
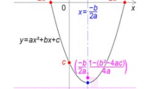
In this seminar you will learn how to graph quadratic functions and …
In this seminar you will learn how to graph quadratic functions and how to use these graphs to identify the roots, or solutions, of the function. You will learn how to use different arrangements of the equation in order to locate specific, important points for the graph. You will also learn why the intercepts of the function translate to solutions of the equation. StandardsCC.2.2.HS.C.5Construct and compare linear, quadratic, and exponential models to solve problems,
Visualize the gravitational force that two objects exert on each other. Change …
Visualize the gravitational force that two objects exert on each other. Change properties of the objects in order to see how it changes the gravity force.
Visualize the gravitational force that two objects exert on each other. Change …
Visualize the gravitational force that two objects exert on each other. Change properties of the objects in order to see how it changes the gravity force.
No restrictions on your remixing, redistributing, or making derivative works. Give credit to the author, as required.
Your remixing, redistributing, or making derivatives works comes with some restrictions, including how it is shared.
Your redistributing comes with some restrictions. Do not remix or make derivative works.
Most restrictive license type. Prohibits most uses, sharing, and any changes.
Copyrighted materials, available under Fair Use and the TEACH Act for US-based educators, or other custom arrangements. Go to the resource provider to see their individual restrictions.