This video segment adapted from NOVA follows the clean-up effort after the …
This video segment adapted from NOVA follows the clean-up effort after the 1989 Exxon Valdez oil spill off the coast of Alaska. Also featured is a marsh where an oil spill occurred 20 years earlier; analysis suggests that environmental damage may last for decades.
In this video segment adapted from the Yukon River Panel, visit fishing …
In this video segment adapted from the Yukon River Panel, visit fishing communities along the Yukon River and see how Alaska Native peoples exercise stewardship of salmon to ensure that it remains a central food source and cultural touchstone.
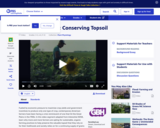
Against the backdrop of the devastating 1930's Dust Bowl, this video segment …
Against the backdrop of the devastating 1930's Dust Bowl, this video segment adapted from Interactive NOVA profiles an organic farmer and the techniques he uses to conserve topsoil.
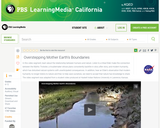
Have we overstepped Mother Earth's boundaries? What are the consequences? In this …
Have we overstepped Mother Earth's boundaries? What are the consequences? In this video segment adapted from Haskell Indian Nations University, hear a Native perspective on our relationship with the natural environment.
This two-sided poster presents images and information about ozone. The front features …
This two-sided poster presents images and information about ozone. The front features a series of color Earth images; each image reflects total ozone readings taken every October from 1979 to 2012. The poster back contains information about ozone under the following headings: What is Ozone?, Chemistry of the Ozone Layer, Measuring Ozone in the Earth's Atmosphere, Timeline of Stratospheric Ozone Depletion and Observations, How the Ozone Hole Forms, and A World Avoided. In addition, the back contains two activities: Visualizing the Ozone Hole and a Color by Number worksheet.
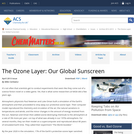
This ChemMatters article provides a history of the study of ozone, a …
This ChemMatters article provides a history of the study of ozone, a description of an experimental simulation called "The World Avoided," a brief introduction to the chemistry of ozone, an explanation of how ozone is measured, and the difference between "good" ozone in the stratosphere vs "bad" ozone in the troposhere. ChemMatters is an educational magazine published by the American Chemical Society.
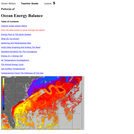
Oceans play a significant role in determining and moderating the effects of …
Oceans play a significant role in determining and moderating the effects of energy imbalances. Students will begin this lesson by working with temperature data to reinforce the importance of protocols, practice computing statistical measures of data and interpreting their significance. The lesson continues with investigations into daily and annual energy cycles. Using a sea surface environment visualizer, students then identify patterns of sea surface current and temperature data. Note that this is lesson five of five on the Ocean Motion website. Each lesson investigates ocean surface circulation using satellite and model data and can be done independently. See Related URL's for links to the Ocean Motion Website that provide science background information, data resources, teacher material, student guides and a lesson matrix.
This is an activity about the atmospheric conditions (greenhouse strength, atmospheric thickness) …
This is an activity about the atmospheric conditions (greenhouse strength, atmospheric thickness) Mars needs to maintain surface water. Learners will use a computer interactive to learn about Mars past and present before exploring the pressure and greenhouse strength needed for Mars to have a watery surface as it had in the past. This lesson is part of Project Spectra, a science and engineering education program focusing on how light is used to explore the Solar System.
This resource is a video abstract of a research paper created by …
This resource is a video abstract of a research paper created by Research Square on behalf of its authors. It provides a synopsis that's easy to understand, and can be used to introduce the topics it covers to students, researchers, and the general public. The video's transcript is also provided in full, with a portion provided below for preview:
"In 2009, 28 world-renowned scientists gathered on a mission: to figure out how to save the planet—or, at least, how far we can push the planet before threatening our survival. The result was a list of nine critical environmental limits below which the Earth’s future would remain safe—by keeping atmospheric carbon low, for example. Exceeding those limits would risk irreversible global damage. But despite providing good science-based measures for monitoring the Earth’s health, these so-called Planetary Boundaries fail to address one very important question: What can you— as a citizen, CEO, city council, or national committee—do to help? That’s where a new approach called Planetary Accounting comes in. The problem with the Planetary Boundaries is that they can’t be directly translated to figures that make sense at smaller scales..."
The rest of the transcript, along with a link to the research itself, is available on the resource itself.
This video segment adapted from NOVA uses animation to show the relationship …
This video segment adapted from NOVA uses animation to show the relationship between the movement of a tectonic plate and whether volcanoes on the Hawaiian Islands are active or dormant.
In this learning activity, students compare changes in insolation with changes in …
In this learning activity, students compare changes in insolation with changes in surface temperature in the polar regions using scientific visualizations of global data sets. Links to readings related to the shrinking ice cap and albedo are included. This is part 1 of a four-part activity on polar science. Extension activities examining air and sea surface temperature in relation to changing Earth albedo are included. This activity is one of several learning activities connected with the 2007 GLOBE Earth system poster.
Graph reading and data analysis are highlighted in this activity where students …
Graph reading and data analysis are highlighted in this activity where students identify the countries that produce the highest levels of polluting atmospheric emissions. They compare these data with the population of the countries, and describe how the percentage of total emissions and total population numbers are related. The resource includes the graph and a student worksheet. This is an activity from Space Update, a collection of resources and activities provided to teach about Earth and space. Summary background information, data and images supporting the activity are available on the Earth Update data site.
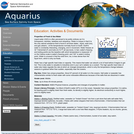
This is a hands-on lab activity about the properties and states of …
This is a hands-on lab activity about the properties and states of water. Learners will complete activities using different liquids to understand the three states of matter, explain how the high heat capacity and abundance of liquid water makes life on Earth possible, and understand that water containing salts and minerals has different properties than fresh water. They will graph data to analyze and articulate results and conclusions. The lab is set up as three stations that small groups of students rotate through; it can also be done as demonstrations (e.g., for younger students). Background information, common preconceptions, a glossary and more is included. This activity is part of the Aquarius Hands-on Laboratory Activities.
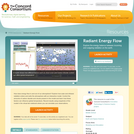
How does energy flow in and out of our atmosphere? Explore how …
How does energy flow in and out of our atmosphere? Explore how solar and infrared radiation enters and exits the atmosphere with an interactive model. Control the amounts of carbon dioxide and clouds present in the model and learn how these factors can influence global temperature. Record results using snapshots of the model in the virtual lab notebook where you can annotate your observations.
This poster illustrates and describes types of high-, low-, and mid-altitude clouds. …
This poster illustrates and describes types of high-, low-, and mid-altitude clouds. Poster back has article and activity related to Earth's water cycle, as well as a cloud identification quiz and a water cycle crossword puzzle.
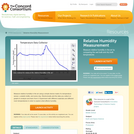
Measure relative humidity in the air using a simple device made of …
Measure relative humidity in the air using a simple device made of a temperature sensor, a plastic bottle, and some clay. Electronically plot the data you collect on graphs to analyze and learn from it. Experiment with different materials and different room temperatures in order to explore what affects humidity.
Using a computer interactive tool, students investigate the changes in coastline that …
Using a computer interactive tool, students investigate the changes in coastline that would result from a change in sea level, and suggest what factors could cause a rise in sea level. The activity asks students to reflect on outcomes of their investigations completed during the Ice Ages and Night Life activities, all of which are part of Space Update, a collection of resources and activities provided to teach about Earth and space. Summary background information, data and images supporting the activity are available on the Earth Update data site. To complete the activity, students will need to access the Space Update multimedia collection, which is available for download and purchase for use in the classroom.
No restrictions on your remixing, redistributing, or making derivative works. Give credit to the author, as required.
Your remixing, redistributing, or making derivatives works comes with some restrictions, including how it is shared.
Your redistributing comes with some restrictions. Do not remix or make derivative works.
Most restrictive license type. Prohibits most uses, sharing, and any changes.
Copyrighted materials, available under Fair Use and the TEACH Act for US-based educators, or other custom arrangements. Go to the resource provider to see their individual restrictions.