In this lesson, students will learn about how volcanoes and mountains affect …
In this lesson, students will learn about how volcanoes and mountains affect weather. Includes video links, discussion, demonstration, and an additional activity.
Students will analyze USGS seismology data in the classroom using spreadsheets and …
Students will analyze USGS seismology data in the classroom using spreadsheets and scatter plots to look for patterns and structure in the Earth's crust. Before analyzing data, students will learn about the methods scientists use to gather seismic data. They will explore plate tectonics, plate boundaries, and volcanoes using Google Earth. The teacher will provide demonstrations on the types of faults and how earthquakes propagate and travel through the earth.
(Note: this resource was added to OER Commons as part of a batch upload of over 2,200 records. If you notice an issue with the quality of the metadata, please let us know by using the 'report' button and we will flag it for consideration.)
In this activity, students learn how to contour topographic data from three-dimensional …
In this activity, students learn how to contour topographic data from three-dimensional models that they create for themselves. Students examine how topographic contour lines differ based on different topographic features.
(Note: this resource was added to OER Commons as part of a batch upload of over 2,200 records. If you notice an issue with the quality of the metadata, please let us know by using the 'report' button and we will flag it for consideration.)
In this classroom activity, students will work in groups to observe how …
In this classroom activity, students will work in groups to observe how patterns of topography, bathymetry, earthquake locations and depths, and the location of volcanoes vary across regions of the Earth. They will then use this data to predict and map the locations and types of major plate tectonic boundaries. Finally, they should begin to form an intuition about the 3D nature of these plate tectonic boundaries by sketching a cross sectional concept diagram through a convergent boundary, plotting surface topography, earthquakes' locations below the surface, the position of volcanoes at the surface, and inferring the location of the plate tectonic boundary at depth.
Meet the Earth OLogists is part of OLogy, where kids can collect …
Meet the Earth OLogists is part of OLogy, where kids can collect virtual trading cards and create projects with them. Here, they meet three kids and one scientist who are all fascinated by rocks: Arjun, a nine-year-old from Ohio who has visited his favorite volcano, Mount St. Helens in Washington State. Diana, a seven-year-old from New Hampshire who has hundreds of rocks in her collection. Ruthmabel, an eight-year-old from Washington State who built a Mars rover model at rocket camp and a model volcano at geology camp. Ed Mathez, a curator of Earth and Planetary Sciences at the Museum, who answers kids questions, including "How do kids start a rock collection?" and "What do you want every kid to know about the Earth?"
This activity is designed as a laboratory exercise and to take ~1-1.5 …
This activity is designed as a laboratory exercise and to take ~1-1.5 hours to finish.
On May 18, 1980, Mt. St. Helens in the state of Washington exploded in a cloud of ash, plus lava and mud flows. What had been a beautiful symmetrical snow-covered mountain with heavily forested slopes became a startling landscape of ash, mud, and downed trees surrounding a broken, irregular peak. The power of the initial blast was directed upward and laterally, snapping off trees for miles in the blast zone. In the years since 1980, many people â geologists, biologists, environmentalists â have been observing and studying how the landscape recovers after a major volcanic eruption.
In this exercise, students study simplified topographic maps of Mt. St. Helens to interpret the shape of the mountain before and after the 1980 eruption. An option is to have them look at the volcano on Google Earth at this point. Student materials include a graph on which to plot two topographic profiles across Mt. St. Helens to illustrate the change in its shape. The accompanying Instruction file includes calculation of the vertical exaggeration of the profiles, but this section of the exercise may be omitted. Assuming that the material removed by the eruption was in the form of a perfect cone, students use their profiles to measure the height and diameter of the cone to calculate the volume of material removed. Students then compare the result of their calculation with published values for the eruptive material removed from the mountain and identify possible sources of error in their work.
This activity takes place outside of the classroom and requires ~1 hour …
This activity takes place outside of the classroom and requires ~1 hour to complete. Students recreate the map of the Mt. St. Helens ash plume of 1980 and use their maps to answer a series of questions about this ashfall.
In this My Path Alexa Van Eaton talks about her work with …
In this My Path Alexa Van Eaton talks about her work with volcanoes in the Pacific Northwest and how scientists keep on top of the all the shaking and quaking.
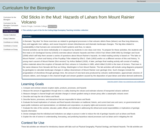
Volcanic debris flows (lahars) flow long distances, bury and aggrade river valleys, …
Volcanic debris flows (lahars) flow long distances, bury and aggrade river valleys, and cause long-term stream disturbances and dramatic landscape changes. Students will evaluate the nature, scale, and history of past lahars from Mount Rainier in a river valley and interpret the past and potential future impact on humans of lahars.
(Note: this resource was added to OER Commons as part of a batch upload of over 2,200 records. If you notice an issue with the quality of the metadata, please let us know by using the 'report' button and we will flag it for consideration.)
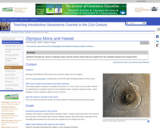
Students use the height and radius of Olympus Mons to estimate its …
Students use the height and radius of Olympus Mons to estimate its volume. They then propose a method to estimate the volume of lava that has erupted over from the Hawaiian hotspot over time. I then show them a graph of the cumulative volcanic volume as a function of distance from Kilauea (from Clague and Dalrymple). They compare these volumes and also consider the possibility that some of the lava erupted from the Hawaiian hotspot has been subducted.
(Note: this resource was added to OER Commons as part of a batch upload of over 2,200 records. If you notice an issue with the quality of the metadata, please let us know by using the 'report' button and we will flag it for consideration.)
Join Scripps Institution's David Hilton as takes us on a journey to …
Join Scripps Institution's David Hilton as takes us on a journey to Costa Rica on the first stage of research to find out if volcanoes put out as much as the earth's mantle takes back during the processes of subduction and volcanism. (28 minutes)
Physical Geology is a comprehensive introductory text on the physical aspects of …
Physical Geology is a comprehensive introductory text on the physical aspects of geology, including rocks and minerals, plate tectonics, earthquakes, volcanoes, glaciation, groundwater, streams, coasts, mass wasting, climate change, planetary geology and much more. It has a strong emphasis on examples from western Canada, especially British Columbia, and also includes a chapter devoted to the geological history of western Canada. The book is a collaboration of faculty from Earth Science departments at Universities and Colleges across British Columbia and elsewhere.
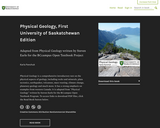
Physical Geology is a comprehensive introductory text on the physical aspects of …
Physical Geology is a comprehensive introductory text on the physical aspects of geology, including rocks and minerals, plate tectonics, earthquakes, volcanoes, mass wasting, climate change, planetary geology and much more. It has a strong emphasis on examples from western Canada. It is adapted from "Physical Geology" written by Steven Earle for the BCcampus Open Textbook Program. To access links to download PDF files, click the Read Book button below.
This optional field trip is designed to augment the in-class learning experience …
This optional field trip is designed to augment the in-class learning experience in introductory physical geology by providing students the opportunity to see firsthand local geological features and understand their context in the long-term tectonic evolution of the western United States. The university is conveniently located in a portion of the American west where a plethora of geological features are readily accessible over a total field trip duration of 6 hours. Over a total of 6 field stops, students are presented with an opportunity to observe features relevant to topics learned in class involving rock types, volcanic features (lava flows and ash fall deposits), faults and folds, mass wasting features, catastrophic flood deposits (Bonneville and Missoula floods), and loess deposits.
(Note: this resource was added to OER Commons as part of a batch upload of over 2,200 records. If you notice an issue with the quality of the metadata, please let us know by using the 'report' button and we will flag it for consideration.)
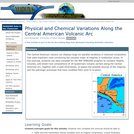
The Central American volcanic arc displays large arc-parallel variations in chemical composition …
The Central American volcanic arc displays large arc-parallel variations in chemical composition that yield important clues concerning the complex origin of magmas in subduction zones. In this exercise, students use data compiled for the NSF MARGINS program to compare heights, volumes, and whole-rock compositions of 39 Quaternary volcanic centers along the Central American arc, together with crustal thicknesses, to assess the possible sources of the magmas and the petrologic processes that have modified them prior to eruption.
(Note: this resource was added to OER Commons as part of a batch upload of over 2,200 records. If you notice an issue with the quality of the metadata, please let us know by using the 'report' button and we will flag it for consideration.)
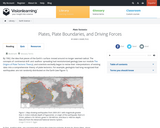
The distribution of earthquakes and volcanoes around the world confirmed the theory …
The distribution of earthquakes and volcanoes around the world confirmed the theory of plate tectonics first proposed by Wegener. These phenomena also help categorize plate boundaries into three different types: convergent, divergent, and transform.
This video segment adapted from NOVA uses animation to show the relationship …
This video segment adapted from NOVA uses animation to show the relationship between the movement of a tectonic plate and whether volcanoes on the Hawaiian Islands are active or dormant.
No restrictions on your remixing, redistributing, or making derivative works. Give credit to the author, as required.
Your remixing, redistributing, or making derivatives works comes with some restrictions, including how it is shared.
Your redistributing comes with some restrictions. Do not remix or make derivative works.
Most restrictive license type. Prohibits most uses, sharing, and any changes.
Copyrighted materials, available under Fair Use and the TEACH Act for US-based educators, or other custom arrangements. Go to the resource provider to see their individual restrictions.