Let's look at price changes for common school items from 2009 to 2019.
- Subject:
- Economics
- Social Science
- Material Type:
- Lesson
- Provider:
- Bureau of Labor Statistics
- Date Added:
- 10/16/2024

Let's look at price changes for common school items from 2009 to 2019.

Students will learn how to create and interpret a pie chart displaying how they spend their time.

This activity is designed to get young students thinking about different occupations and reflecting on what they may want to be when they grow up. They will get an idea of how much money each worker makes in these occupations, and learn how to find pay and education data using the U.S. Bureau of Labor Statistics Career Exploration webpage.

Learn how BLS measures total factor productivity, which compares changes in output over time to changes in a combination of inputs, including capital, labor, energy, materials, and purchased services.

The Bureau of Labor Statistics (BLS) uses location quotients, or LQs, to see where occupations or industries are concentrated in the United States. LQs compare local employment in an occupation or industry to national employment in that occupation or industry. An LQ higher than one means an occupation or industry is more concentrated in that area than in the nation. An LQ less than one means an occupation or industry is less concentrated in that area than in the nation.

Check out maps displaying data on monthly and annual employment and unemployment across the United States.

How fast can you match all of the BLS images? To play, click on the start button to reveal all images for a few seconds. Once the images are hidden, the timer will start and you can begin to click on the gray boxes to try to reveal matched pairs. If you want to play a harder version, set HARD MODE to ON (located above timer). Hard mode will require you to match all images without making a mistake. If you make a mistake, all the cards will be hidden again. Hope your memory is sharp!

A look at how millennials spend their money.

Prices for consumer goods and services are always changing. In general, prices have increased over time; this is known as inflation. Inflation is a process of continuously rising prices or, equivalently, of a continuously falling value of money. To determine how prices are changing, the Bureau of Labor Statistics (BLS) asks people how much money they spend on various products and services, then data collectors visit thousands of stores each month to collect prices of goods and services throughout the country. After all of the data are collected, BLS is able to calculate the Consumer Price Index (CPI). The inflation calculator will allow you to easily determine changes in the buying power of a dollar. Buying power is the amount of goods and services that can be purchased with a unit of currency, in our case U.S. dollars.

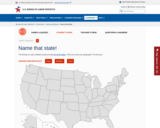
The Bureau of Labor Statistics produces data for all 50 states. Think you know your geography? Try this quiz!

Output is the amount of goods or services created or produced, such as the number of shirts made or number of meals served. The change in the number of shirts made one year compared with the number made the previous year is called the growth in output.

The periodic table of chemical elements, created by Dmitry Mendeleev in 1869, is one of the most important achievements in modern science. To celebrate this achievement, BLS has created our own periodic table! Instead of elements, we have used Science, Technology, Engineering and Math (STEM) occupations. Workers in STEM occupations use science and mathematics to understand how the world works and to solve problems. Hover over an "element" or group to highlight that discipline.

Explore the meaning of productivity and learn how productivity growth can lead to improvements in our lives and the well-being of our nation.

Learn the basics of productivity, how it’s measured, and why it’s important.

The Bureau of Labor Statistics (BLS) calculates productivity to help provide information on the status of the economy. Productivity measures how efficiently inputs are converted into output. An input can include materials, machinery, electricity, business services, and the time people spend working. Output is the amount of goods or services made.

Many surveys at the Bureau of Labor Statistics(BLS) use samples to collect data and calculate statistics on the economy. With a random sample, people are chosen randomly to respond. A representative sample includes people chosen because they have certain characteristics related to what we would like to know about. With representative samples, we can ask a specific portion of the population questions about the economy and then use their answers to talk about the population as a whole. For example, if you wanted to answer a question about high schoolers and sports, you might use a representative sample of high schoolers who play sports, rather than using a random sample and asking anyone.

There will be 10 slight differences between the original BLS publication and the modified version. Spot the differences as quickly as possible to earn point and time bonuses. If you get stuck use one of your "helps" to reveal a difference. Try easy mode for unlimited helps, and hard mode for a big score.

How does your day compare to that of the average American?

A look at occupational employment in the United States.

Learn the terms and ideas that can help you understand employment projections data from the U.S. Bureau of Labor Statistics.