Students will explore wetland hydrology and biology and decide whether or not …
Students will explore wetland hydrology and biology and decide whether or not to restore a wetland or retain dams and drainage systems.
(Note: this resource was added to OER Commons as part of a batch upload of over 2,200 records. If you notice an issue with the quality of the metadata, please let us know by using the 'report' button and we will flag it for consideration.)
Developed for Lifelines Online by Michelle Fisher at Three Rivers Community College, Poplar Bluff, Missouri. (http://www.bioquest.org/lifeline/ (more info) )
The course will discuss the objectives and functions of water management systems …
The course will discuss the objectives and functions of water management systems for irrigation and drainage purposes. Analysing system requirements in terms of technical engineering constraints, management possibilities and water users (wishes and options) is central. This includes the design and operation of regulation structures, dams, reservoirs, weirs and conveyance systems; balancing water supply and water requirements in time and space is a main focus of analysis too.
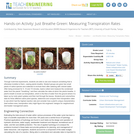
This assignment offers students several problems that help them understand the basic …
This assignment offers students several problems that help them understand the basic of mixing models and their use in understanding the controls on water quality in the environment. The purpose of the assignment is to help students integrate across the various topics in environmental chemistry in the context of flow and transport. Students will hopefully learn how reactive and non-reactive tracers can be used in conjunction to fully understand a chemical system.
(Note: this resource was added to OER Commons as part of a batch upload of over 2,200 records. If you notice an issue with the quality of the metadata, please let us know by using the 'report' button and we will flag it for consideration.)
The students will use activities to understand atomic mass and isotopes and …
The students will use activities to understand atomic mass and isotopes and stable isotopic fractionation in the hydrologic system.
(Note: this resource was added to OER Commons as part of a batch upload of over 2,200 records. If you notice an issue with the quality of the metadata, please let us know by using the 'report' button and we will flag it for consideration.)
Our students will be studying and exploring the human impact on groundwater. …
Our students will be studying and exploring the human impact on groundwater. They will study the water deprivation impacts both locally and in the San Joaquin Valley. Students will explore and come to understand the benefits of collecting rainwater. We partnered with the City of Eugene and had the wonderful Jackie come in. Our students brought in many of the materials including cardboard boxes, empty plastic containers (sour cream, water bottles,etc), tin foil, wax paper, duct tape,etc. We as teachers provided the underground sprinkler tubing cutting material, more tape and supplies. We tested this project with our 5th graders so we could make improvements and continue this project next year. In order to complete this project, we needed a full three weeks of working for an hour plus every day. We incorporated this project into our reading and science timeline.
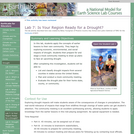
1) What are some of the biological effects of dam removal (good …
1) What are some of the biological effects of dam removal (good and bad)?
2) What are some of the more pressing/compelling reasons to remove a dam? Explain.
3) The Stanley and Doyle (2003) article states that, "dam removal cannot be avoided." Hypothetically, let's say you are placed on a committee to oversee the removal of the Aswan High Dam, since Doyle et al. (2003) states that, "the functional lifespan of most dams is approximately 60-120 years." What scientific studies would you conduct before/during/after dam removal? Why?
(Note: this resource was added to OER Commons as part of a batch upload of over 2,200 records. If you notice an issue with the quality of the metadata, please let us know by using the 'report' button and we will flag it for consideration.)
Through multi-trial experiments, students are able to see and measure something that …
Through multi-trial experiments, students are able to see and measure something that is otherwise invisible to them seeing plants breathe. Student groups are given two small plants of native species and materials to enclose them after watering with colored water. After being enclosed for 5, 10 and 15 minutes, teams collect and measure the condensed water from the plants' "breathing," and then calculate the rates at which the plants breathe. A plant's breath is known as transpiration, which is the flow of water from the ground where it is taken up by roots (plant uptake) and then lost through the leaves. Students plot volume/time data for three different native plant species, determine and compare their transpiration rates to see which had the highest reaction rate and consider how a plant's unique characteristics (leaf surface area, transpiration rate) might figure into engineers' designs for neighborhood stormwater management plans.
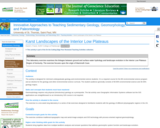
This laboratory exercise examines the linkages between ground and surface water hydrology …
This laboratory exercise examines the linkages between ground and surface water hydrology and landscape evolution in the Interior Low Plateaus Region of Kentucky. The exercise focuses upon the origin of Mammoth Cave.
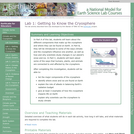
In this introductory lab, students are introduced to the different components that …
In this introductory lab, students are introduced to the different components that make up the cryosphere and watch a NASA animation showing an example of how global land and sea ice coverage can change over the course of a single year. In the second part of the lab, students learn about some of the ways that changes in the cryosphere are already impacting human life.
(Note: this resource was added to OER Commons as part of a batch upload of over 2,200 records. If you notice an issue with the quality of the metadata, please let us know by using the 'report' button and we will flag it for consideration.)
Using data on the world's water distribution, students calculate the percentage of …
Using data on the world's water distribution, students calculate the percentage of water that is available to humans and examine graphics that illustrate the distribution. Students develop a sense of where the world's water is located and how it moves through the Earth system.
(Note: this resource was added to OER Commons as part of a batch upload of over 2,200 records. If you notice an issue with the quality of the metadata, please let us know by using the 'report' button and we will flag it for consideration.)
Students build a physical model to explore watershed features, then use Google …
Students build a physical model to explore watershed features, then use Google Earth software to tie the model to a real place. By exploring several layers of map-based images and data, students develop an appreciation of the complexity of a watershed and river system in the context of a both a local and national scale.
(Note: this resource was added to OER Commons as part of a batch upload of over 2,200 records. If you notice an issue with the quality of the metadata, please let us know by using the 'report' button and we will flag it for consideration.)
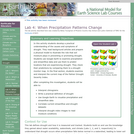
In this activity students develop a practical understanding of the causes and …
In this activity students develop a practical understanding of the causes and symptoms of drought. They read background articles and prepare a physical model to illustrate the role that soil moisture plays in preventing or promoting drought. Students use Google Earth to examine precipitation and streamflow data and use them to predict locations that are experiencing drought. They check their predictions by comparing them to a drought monitor map. In the final section, students examine and interpret the current map of the Palmer Drought Severity Index.
(Note: this resource was added to OER Commons as part of a batch upload of over 2,200 records. If you notice an issue with the quality of the metadata, please let us know by using the 'report' button and we will flag it for consideration.)
In Lab 5, students learned about some of the global circulation processes …
In Lab 5, students learned about some of the global circulation processes that transport both matter and energy around the planet. In Lab 6A they get a much more specific picture of the Earth system at the global scale as they investigate data collected by NASA satellites. The data is displayed in image form in the NEO (NASA Earth Observations) data visualization tool. How do the four interconnected spheres show up at the global scale in these data representations? Is it possible, from studying this data, to infer some of the same interconnections at the global scale that were identified at the local study site? What can students infer from studying changes across the seasons? In Lab 6B students play a game that focuses their attention on the global water cycle, but at the particle scale: what might happen to this molecule of water that falls onto the ground, or into a stream? Next they step back to the macroscopic scale as they diagram the ways in which water moves through the four interconnected spheres of the Earth system.
(Note: this resource was added to OER Commons as part of a batch upload of over 2,200 records. If you notice an issue with the quality of the metadata, please let us know by using the 'report' button and we will flag it for consideration.)
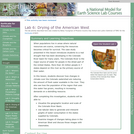
America's most famous drought resulted in an environmental disaster called the Dust …
America's most famous drought resulted in an environmental disaster called the Dust Bowl. From 1931 to 1939, a five-state region of the Great Plains received little rain and experienced horrendous dust storms that stripped the land of its topsoil. The event went on to shape the demographics of the American West as thousands of people migrated out of the plains and on to western states. In this activity, students will watch a PBS video and/or interact with the video's companion website. They will also examine maps and animations that show the distribution of drought patterns over the past 300 years; these maps were reconstructed from environmental records. Finally, students will examine the amount of time different areas spend in drought.
(Note: this resource was added to OER Commons as part of a batch upload of over 2,200 records. If you notice an issue with the quality of the metadata, please let us know by using the 'report' button and we will flag it for consideration.)
When populations live in areas where natural resources are scarce, conserving them …
When populations live in areas where natural resources are scarce, conserving them becomes critical for survival. The case study presented in this lesson introduces students to a real drought that has been developing in the Colorado River basin for many years. The Colorado River is the major source of water for people in the driest part of the United States. More than 30 million people in 7 states depend on this river as the primary source of their water. In this lesson, students discover how changes in climate over the Colorado watershed are reducing the amount of fresh water available in the river. They also see how the population of the region that uses this water has grown, resulting in increasing demands on a dwindling resource.
(Note: this resource was added to OER Commons as part of a batch upload of over 2,200 records. If you notice an issue with the quality of the metadata, please let us know by using the 'report' button and we will flag it for consideration.)
In this lab, students apply the concepts of earlier lessons to their …
In this lab, students apply the concepts of earlier lessons to their own community. They begin by exploring economic, environmental, and social impacts of drought. Students then prepare for and stage a mock community meeting to draw up plans to face an upcoming drought.
(Note: this resource was added to OER Commons as part of a batch upload of over 2,200 records. If you notice an issue with the quality of the metadata, please let us know by using the 'report' button and we will flag it for consideration.)
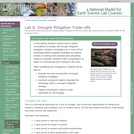
In this activity students explore how to reduce vulnerability to drought risk …
In this activity students explore how to reduce vulnerability to drought risk through mitigation strategies. Students investigate one or more of four technology-based mitigation strategies by reading articles or viewing short podcasts and completing hands-on activities. Students make a presentation or poster to communicate their findings to the class.
(Note: this resource was added to OER Commons as part of a batch upload of over 2,200 records. If you notice an issue with the quality of the metadata, please let us know by using the 'report' button and we will flag it for consideration.)
Students use a small stream table in groups to investigate how channel …
Students use a small stream table in groups to investigate how channel form determines the shape of the hydrograph (including lag to peak). They use three channels: no channel (just sediment filling the table), a "concrete" channel (straight, no sediment on bottom), and a meandering channel. All channels get the same water input and students measure the amount of water that comes out to make a hydrograph. This gives students a chance to model a flood pulse moving through different channels to see how anthropogenic changes to rivers, such as channelizing them, alters flood hydrology. It specifically models an outburst flood from a dam release or burst, but is basically modeling any pulse of water moving through a system.
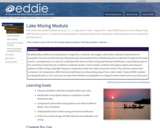
Stratified lakes exhibit vertical gradients in organisms, nutrients, and oxygen, which have …
Stratified lakes exhibit vertical gradients in organisms, nutrients, and oxygen, which have important implications for ecosystem structure and functioning. Mixing disrupts these gradients by redistributing these materials throughout the water column. Consequently, it is critical to understand the drivers of lake mixing and thermal stratification, especially because of the sensitivity of lake thermal conditions to altered climate. In this module, students will explore spatial and temporal patterns of lake mixing using high-frequency temperature data from lakes around the world. They will also explore how increases in air temperature affect thermal stratification by interpreting output from a lake model. Project EDDIE modules are designed with an A-B-C structure to make them flexible and adaptable to a range of student levels and course structures.
(Note: this resource was added to OER Commons as part of a batch upload of over 2,200 records. If you notice an issue with the quality of the metadata, please let us know by using the 'report' button and we will flag it for consideration.)
This module was initially developed by Carey, C.C., J.L. Klug, and R.L. Fuller. 1 August 2015. Project EDDIE: Dynamics of Lake Mixing. Project EDDIE Module 3, Version 1. cemast.illinoisstate.edu/data-for-students/modules/lake-mixing.shtml. Module development was supported by NSF DEB 1245707.
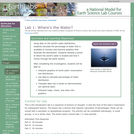
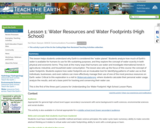
This lesson helps students understand why Earth is considered the "water planet." …
This lesson helps students understand why Earth is considered the "water planet." Students analyze how much of Earth's water is available for humans to use for life-sustaining purposes, and they explore the concept of water scarcity in both physical and economic terms. They look at the many ways that humans use water and investigate international trends in agricultural, industrial, and household water consumption. The lesson also sets up the focus of this course: the concept of water footprints. Students explore how water footprints are an invaluable tool for identifying patterns of water use so that individuals, businesses, and even nations can more effectively manage their use of one of the most precious resources on Earth: water. Critical to this exploration is a visit to Watercalculator.org, where students calculate their personal water usage, analyze the results, and set a base point for tracking and conserving their water use.
This is the first of the three-part Lessons for Understanding Our Water Footprint: High School Lesson Plans.
(Note: this resource was added to OER Commons as part of a batch upload of over 2,200 records. If you notice an issue with the quality of the metadata, please let us know by using the 'report' button and we will flag it for consideration.)
No restrictions on your remixing, redistributing, or making derivative works. Give credit to the author, as required.
Your remixing, redistributing, or making derivatives works comes with some restrictions, including how it is shared.
Your redistributing comes with some restrictions. Do not remix or make derivative works.
Most restrictive license type. Prohibits most uses, sharing, and any changes.
Copyrighted materials, available under Fair Use and the TEACH Act for US-based educators, or other custom arrangements. Go to the resource provider to see their individual restrictions.