Students will look at data showing how the “millennial” generation differs from …
Students will look at data showing how the “millennial” generation differs from other generations. They will analyze and evaluate social changes evident in the data. Then they will work with a partner to compose a newsletter.
This lesson unit is intended to help teachers assess how well students …
This lesson unit is intended to help teachers assess how well students are able to: work with concepts of congruency and similarity, including identifying corresponding sides and corresponding angles within and between triangles; Identify and understand the significance of a counter-example; Prove, and evaluate proofs in a geometric context.
Students will explore maps containing census data from 1950 through 2000. They …
Students will explore maps containing census data from 1950 through 2000. They will analyze how education levels and median household incomes have changed over time and determine how the two might be correlated. Students will also come up with ideas for policies that could help address issues related to income and education.
A statistics lesson on describing and making claims from data representations, specifically …
A statistics lesson on describing and making claims from data representations, specifically linearly increasing data. Applies ideas of rate-of-change to develop writing a linear equation to fit the data, using the equation to interpolate and extrapolate additional information, and integrating the mathematical interpretation appropriately into a social sciences argument.
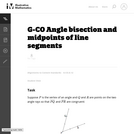
This task provides a construction of the angle bisector of an angle …
This task provides a construction of the angle bisector of an angle by reducing it to the bisection of an angle to finding the midpoint of a line segment. It is worth observing the symmetry -- for both finding midpoints and bisecting angles, the goal is to cut an object into two equal parts. The conclusion of this task is that they are, in a sense, of exactly equivalent difficulty -- bisecting a segment allows us to bisect and angle (part a) and, conversely, bisecting an angle allows us to bisect a segment (part b). In addition to seeing how these two constructions are related, the task also provides an opportunity for students to use two different triangle congruence criteria: SSS and SAS.
A student activity to determine the angle of repose and what factors …
A student activity to determine the angle of repose and what factors determine the angle of repose.
(Note: this resource was added to OER Commons as part of a batch upload of over 2,200 records. If you notice an issue with the quality of the metadata, please let us know by using the 'report' button and we will flag it for consideration.)
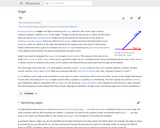
In plane geometry, an angle is the figure formed by two rays, …
In plane geometry, an angle is the figure formed by two rays, called the sides of the angle, sharing a common endpoint, called the vertex of the angle.[1] Angles formed by two rays lie in a plane, but this plane does not have to be a Euclidean plane. Angles are also formed by the intersection of two planes in Euclidean and other spaces. These are called dihedral angles
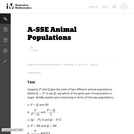
In this task students have to interpret expressions involving two variables in …
In this task students have to interpret expressions involving two variables in the context of a real world situation. All given expressions can be interpreted as quantities that one might study when looking at two animal populations.
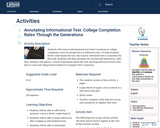
Students will read an informational text about variations in college completion rates …
Students will read an informational text about variations in college completion rates for people born in different years. To help students better understand the text, the teacher will model how to annotate the first half. Students will then annotate the second half themselves. After that, students will answer a series of questions about the text, drawing inferences from what they’ve read and citing textual evidence to support their responses.
Students will examine a table of 1850 Census data on employment to …
Students will examine a table of 1850 Census data on employment to understand the professions of free men across the United States at the time, calculating the percentages working in different industries. Students will also compare and contrast economies in the North and South during the Antebellum Period.
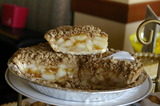
Students are asked to assist a production manager of a local school …
Students are asked to assist a production manager of a local school that will be producing apple pies as a fundraiser. Students need to understand rates and starting conditions to help schedule the right number of volunteers for each production station so that the maximum number of pies can be produced.
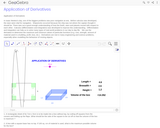
We use the derivative to determine the maximum and minimum values of …
We use the derivative to determine the maximum and minimum values of particular functions (e.g. cost, strength, amount of material used in a building, profit, loss, etc.).Differentiation is also used in analysis of finance and economics.
This is a lesson plan for a project based learning activity geared …
This is a lesson plan for a project based learning activity geared towards high school students who are enrolled in a geometry class. The project has the students discover how geometry is connected to real world situations instead of being just a subject taught in a classroom. The Indiana Academic Standards that may apply to this activity are G.LP.2, G.T.1, G.T.5, G.QP.1, G.CI.4, G.TS.3, and G.TS.5.
This final lesson in the unit culminates with the Go Public phase …
This final lesson in the unit culminates with the Go Public phase of the legacy cycle. In the associated activities, students use linear models to depict Hooke's law as well as Ohm's law. To conclude the lesson, students apply they have learned throughout the unit to answer the grand challenge question in a writing assignment.
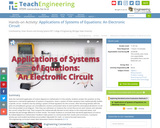
Does the real-world application of science depend on mathematics? In this activity, …
Does the real-world application of science depend on mathematics? In this activity, students answer this question as they experience a real-world application of systems of equations. Given a system of linear equations that mathematically models a specific circuit—students start by solving a system of three equations for the currents. After becoming familiar with the parts of a breadboard, groups use a breadboard, resistors and jumper wires to each build the same (physical) electric circuit from the provided circuit diagram. Then they use voltmeters to measure the current flow across each resistor and calculate the current using Ohm’s law. They compare the mathematically derived current values to the measured values, and calculate the percentage difference of their results. This leads students to conclude that real-world applications of science do indeed depend on mathematics! Students make posters to communicate their results and conclusions. A pre/post-activity quiz and student worksheet are provided. Adjustable for math- or science-focused classrooms.
Students will use state and regional unemployment data for various education levels …
Students will use state and regional unemployment data for various education levels to create scatter plots and calculate correlation coefficients. Students will then compare scatter plots with different strengths of linear relationships and will determine the impact of any influential points on the correlation coefficient.
Measuring the dimensions of nano-circuits requires an expensive, high-resolution microscope with integrated …
Measuring the dimensions of nano-circuits requires an expensive, high-resolution microscope with integrated video camera and a computer with sophisticated imaging software, but in this activity, students measure nano-circuits using a typical classroom computer and (the free-to-download) GeoGebra geometry software. Inserting (provided) circuit pictures from a high-resolution microscope as backgrounds in GeoGebra's graphing window, students use the application's tools to measure lengths and widths of circuit elements. To simplify the conversion from the on-screen units to the real circuits' units and the manipulation of the pictures, a GeoGebra measuring interface is provided. Students export their data from GeoGebra to Microsoft® Excel® for graphing and analysis. They test the statistical significance of the difference in circuit dimensions, as well as obtain a correlation between average changes in original vs. printed circuits' widths. This activity and its associated lesson are suitable for use during the last six weeks of the AP Statistics course; see the topics and timing note below for details.
The main objective of this lesson is to illustrate an important application …
The main objective of this lesson is to illustrate an important application of mathematics in practical life -- namely in art. Most of the pictures selected for this lesson are visible on the walls of Al-Hambra – Granada (Spain), which is one of the most important landmarks in the Islamic civilization. There are three educational goals for this lesson: (1) establishing the concept of isometries; (2) giving real-life examples of groups; (3) demonstrating the importance of matrices and their applications. As background for this lesson, students just need some familiarity with the concept of a group and a limited knowledge about matrices and the inverse of a non-singular matrix.
Students are introduced to Pascal's law, Archimedes' principle and Bernoulli's principle. Fundamental …
Students are introduced to Pascal's law, Archimedes' principle and Bernoulli's principle. Fundamental definitions, equations, practice problems and engineering applications are supplied. A PowerPoint® presentation, practice problems and grading rubric are provided.
No restrictions on your remixing, redistributing, or making derivative works. Give credit to the author, as required.
Your remixing, redistributing, or making derivatives works comes with some restrictions, including how it is shared.
Your redistributing comes with some restrictions. Do not remix or make derivative works.
Most restrictive license type. Prohibits most uses, sharing, and any changes.
Copyrighted materials, available under Fair Use and the TEACH Act for US-based educators, or other custom arrangements. Go to the resource provider to see their individual restrictions.