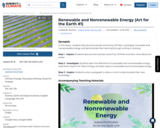
Students use real-world data to evaluate whether solar power is a viable …
Students use real-world data to evaluate whether solar power is a viable energy alternative for several cities in different parts of the U.S. Working in small groups, they examine maps and make calculations using NREL/US DOE data from the online Renewable Energy Living Lab. In this exercise, students analyze cost and availability for solar power, and come to conclusions about whether solar power is a good solution for four different locations.
Students use real-world data to evaluate the feasibility of solar energy and …
Students use real-world data to evaluate the feasibility of solar energy and other renewable energy sources in different U.S. locations. Working in small groups, students act as engineers evaluating the suitability of installing solar panels at four company locations. They access data from the online Renewable Energy Living Lab from which they make calculations and analyze how successful solar energy generation would be, as well as the potential for other power sources at those locations. Then they summarize their results, analysis and recommendations in the form of feasibility plans prepared for a CEO.
In this eight-lesson unit, students explore cultural connections with the sun, learn …
In this eight-lesson unit, students explore cultural connections with the sun, learn about light and discover how light interacts with other materials through hands-on activities, literacy integration, and engineering.
This video explores the myth that developing or emerging countries/cities (Africa, Mexico, …
This video explores the myth that developing or emerging countries/cities (Africa, Mexico, Dubai, Peru) must be dependent on coal, oil or gas because of their poor economies and not on clean, renewable energy sources because of the expense. Innovative clean energy storage techniques and base load power is discussed.
SYNOPSIS: In this lesson, students discuss and evaluate artwork by Jill Pelto, …
SYNOPSIS: In this lesson, students discuss and evaluate artwork by Jill Pelto, investigate renewable and nonrenewable energy, and demonstrate their learning through writing or drawing.
SCIENTIST NOTES: This lesson demonstrates the impact of climate change in our ecosystem through Jill Pelto's arts. Arts appear to be an effective tool in climate science communication. The lesson has passed our scientist review and is recommended for classroom use.
POSITIVES: -This lesson creates a collaborative atmosphere for the unit. -Students are able to identify how meaning can be created through art, especially when learning about fossil fuels and their damage to the environment. -Students can identify and share their own thoughts and feelings about Jill Pelto's artworks.
ADDITIONAL PREREQUISITES: -This is lesson 1 of 6 in our 3rd-5th grade Art for the Earth unit. -iPads or computers with Internet connectivity are necessary. -Students will need basic research skills and computer skills. -Teachers will need to create a free Newsela account to access the readings on renewable and nonrenewable energy.
DIFFERENTIATION: -Teacher can create groups to include mixed ability levels, especially when students are taking notes on renewable and nonrenewable energy in the Investigate section. -Teacher can pause throughout the reading of Sven's Search for Clean Energy to encourage students to write in the "Learned" section of their KWL charts. -The two Newsela articles on renewable and nonrenewable energy are available in many reading levels. Teacher can select the appropriate reading level for each student.
Students listen to radio broadcasts about climate change causes, impacts, and solutions …
Students listen to radio broadcasts about climate change causes, impacts, and solutions and learn how this creates a framework for effective scientific communication.
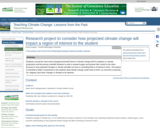
This Research Paper Assignment is designed for NSF & LMF courses (STEM …
This Research Paper Assignment is designed for NSF & LMF courses (STEM majors). The assignment is to have students research a global scientific issue. Possible topics that work well for this assignment contain solar panel use, the increase in health issues (like respiratory or mental health conditions) due to global warming/climate change, animal (and other living organism) extinction (or increase) due to global warming, sea level rise, coastal flooding, how the increase in ocean plastics affects the ocean and its species (which affect the environment/climate), etc. However, any global scientific topic will do. The assignment's main objectives are to scaffold the overall research paper to improve students Inquiry and Problem Solving (IPS) and Global Learning (GL) competencies. The IPS competency is scaffolded with 2 CER worksheets that help students analyze their research sources using the Claim Evidence Reasoning and Rebuttal (CER) method, which they will utilize in LaGuardia's Natural Sciences Courses. The CER method is the Scientific Method, which uses more everyday language. For example, instead of being asked to formulate a hypothesis, students generate a testable claim. By convention, this method is referred to as the CER Method. However, I include the second, and write CERR Method, to remind students to include possible contradictions, challenges, and/or rebuttals to experiments they do and while researching studies in scientific journals and from other sources. Additionally, there is a worksheet with prompts that ask students to reflect on the 3 dimensions of the Global Learning Competencies, based on their research topics, to enhance students ability with this competency. Students are expected to work on these worksheets throughout the semester. The worksheets are due, at different times throughout the semester, before the final paper is due. Ideally the first worksheet is due the fourth week of lecture, typically 1 to 2 weeks after the first library visit. The second and third worksheets are due the 6th and 8th week of lecture, respectively. The first two worksheets are the same CERR method worksheets. Students will complete one worksheet for each of the 2 articles they must use for their research. To further help students organize and engage with what they learn from their research, students are also required to complete a 3-5 minute Power Point presentation. The in-class presentation is due at least a week before the final paper is due, either the ninth or tenth week of the semester. This is a great opportunity for the entire class to share what they learned and to give each other feedback about the organization, content, and overall delivery of each other's research before the final paper is due. There is a presentation guideline and grading rubric that is to be discussed before the presentations; it is better to discuss the rubric with the class at least a week before the presentation is due. Students have the grading rubric and a grade sheet for each presenter so they can score each presenter and write down notes to give feedback to the presenters. I collect the score sheets to view how students evaluated each other's presentations and as proof of participation during presentation day. However, the score sheets do not affect the students' presentation grade. Having students fill out the score sheets is an in-class activity meant to keep students focused on the presentations. Students are required to give presenters feedback, and/or ask questions, to earn "Class-Participation" points for the day; students may lose up to 2% of their total grade for each lecture they do not participate in. The final paper is also outlined for format and content, which is like the presentation guideline and worksheets. The paper outline further describes, and specifies, the types of information to include in each section of the research paper. The point of this document is to prepare students for what their own papers and lab reports should include as they progress with their classes. The final paper is due 1-2 weeks after the presentation is due, which is the 11th or 12th week of the semester. The worksheet component of this assignment is worth 10% of the grade. The two CERR worksheets are worth 3% (6% for 2 worksheets). The Global Learning Worksheet counts toward 4% of the final grade. The Power Point Presentation is worth 5% and the final paper is also worth 5%. The research assignment totals 20% of the final course grade.
Detailed information is provided in activity description/assignment and an example lab handout …
Detailed information is provided in activity description/assignment and an example lab handout that assisted students in conducting their research.
Initial guidelines given to students:
Choose a location (where you are from, a place that is of interest to you) and investigate how projected changes in climate will affect that area. What are the expected changes in temperature, precipitation, storms, droughts, sea level, seasonality, etc? How will this affect the habitat of the area (for humans, animals, and plants)? How will this affect the local economy? What actions can the people that live in this area take to lessen the impacts of changing climate? Students write a scientific style paper on their findings, and present their research to the class in ~10 minute oral presentations (alternatively a poster session could be used).
(Note: this resource was added to OER Commons as part of a batch upload of over 2,200 records. If you notice an issue with the quality of the metadata, please let us know by using the 'report' button and we will flag it for consideration.)
This course is an introduction to real-world dynamics of public policy controversies. …
This course is an introduction to real-world dynamics of public policy controversies. Topics to be considered include national, state, and local policy disputes, such as smoking, hazardous waste, abortion, gun control, and education. Using a case study approach, students study whether and how those disputes get resolved. Students conduct debates and simulations in addition to writing a series of short essays.
Resource Watch features hundreds of data sets all in one place on …
Resource Watch features hundreds of data sets all in one place on the state of the planet's resources and citizens. Users can visualize challenges facing people and the planet, from climate change to poverty, water risk to state instability, air pollution to human migration.
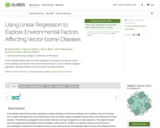
In this activity students will use linear regression to analyze real data …
In this activity students will use linear regression to analyze real data on vector-borne diseases such as Malaria, Zika, and LaCrosse Virus. Students will explore how environmental factors such as climate change or population density influence the transmission of these diseases. The activities are designed for face-to-face instruction and may be adapted for an online classroom. This material is based upon work supported by the National Science Foundation under Grant No. 1919613. Any opinions, findings, and conclusions or recommendations expressed in this material are those of the author(s) and do not necessarily reflect the views of the National Science Foundation.
This is the ninth and final lesson in a series of lessons …
This is the ninth and final lesson in a series of lessons about climate change. This lesson focuses on the various activities that humans can do to mitigate the effects of climate change. This includes information on current and predicted CO2 emission scenarios across the globe, alternative energy sources, and how people are currently responding to climate change. Importantly, this lesson is motivating in showing students that they can make a difference.
In this video, students learn how scientific surveys of wildlife are performed …
In this video, students learn how scientific surveys of wildlife are performed at a site in Yosemite, California. These surveys, in conjunction with studies from the early 1900s, provide evidence that animal populations in Yosemite have shifted over time in response to rising temperatures.
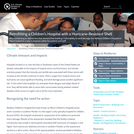
After conducting an assessment that showed their buildings vulnerability to wind damage, …
After conducting an assessment that showed their buildings vulnerability to wind damage, the Nicklaus Childrens Hospital in Miami looked for a way to improve safety for patients and staff.
The students create a conceptual framework showing the scientific basis of climate …
The students create a conceptual framework showing the scientific basis of climate change and its impacts on land and services provided, and figuring out the causes and consequences of the different phenomena.
This video describes the work of scientists who are studying the precise …
This video describes the work of scientists who are studying the precise combination of trees that would be most effective in reducing the level of greenhouse gases in the air around Syracuse, NY. This is a pilot study that will serve as a model for other urban areas.
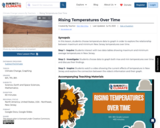
SYNOPSIS: In this lesson, students choose temperature data to graph in order …
SYNOPSIS: In this lesson, students choose temperature data to graph in order to explore the relationship between maximum and minimum New Jersey temperatures over time.
SCIENTIST NOTES: This lesson encourages students to create a visual representation of an available climate dataset. A class discussion walks students through the data and how to navigate through the available information. Students are provided instructions on how to create a graph and are allowed to choose which data they will visually represent. The Student Document introduces and invites students to conduct data analysis on their chosen dataset and encourages critical thinking skills. A short video and discussion questions help students relate current information back to their chosen datasets. This is an interactive lesson that incorporates data analysis with the current issue of climate change.
POSITIVES: -This lesson can be used in any math class. -Students are given voice and choice in this lesson. -Students learn to apply real-world data from a table into a comparable graph. -Students explore the connection between data, graphs, and current effects.
ADDITIONAL PREREQUISITES: -Students should have a basic understanding of average and how it is calculated. -Students should have a basic understanding of reading data tables. -Students should have a basic understanding of graphing and coordinate points expressed as (x, y). -Students should have a basic understanding of the relationship between the x- and y-axes.
DIFFERENTIATION: -Students’ communication and vocabulary can be simple or content-specific with math terminology. -Students can use their graph to make an infographic about temperature and climate change. Students can then present their infographic in class, in a school club, or in the community to raise awareness. -Students can find the line of best fit, find the equation of that line in y = mx + b form, and explain what that line shows about the relationship between average temperatures and time. -Students can use the same data and make different graphs (e.g., bar graph, pie chart, etc.). Students can explain how each graph emphasizes different parts of the same data and explain which graph is best in conveying a specific conclusion.
Warming oceans and melting landlocked ice caused by global climate change may …
Warming oceans and melting landlocked ice caused by global climate change may result in rising sea levels. This rise in sea level combined with increased intensity and frequency of storms will produce storm surges that flood subways, highways, homes, and more. In this activity, visitors design and test adaptations to prepare for flooding caused by sea level rise.
No restrictions on your remixing, redistributing, or making derivative works. Give credit to the author, as required.
Your remixing, redistributing, or making derivatives works comes with some restrictions, including how it is shared.
Your redistributing comes with some restrictions. Do not remix or make derivative works.
Most restrictive license type. Prohibits most uses, sharing, and any changes.
Copyrighted materials, available under Fair Use and the TEACH Act for US-based educators, or other custom arrangements. Go to the resource provider to see their individual restrictions.