This video is the third in a three-part series by the Sea …
This video is the third in a three-part series by the Sea Change project, about scientists' search for Pleiocene beaches in Australia and elsewhere to establish sea level height during Earth's most recent previous warm period. This segment features the research of Jerry Mitrovica, Harvard geophysicist.
The purpose of this activity is to identify global patterns and connections …
The purpose of this activity is to identify global patterns and connections in environmental data contained in the GLOBE Earth Systems Poster, to connect observations made within the Earth Systems Poster to data and information at the National Snow and Ice Data Center, and to understand the connections between solar energy and changes at the poles, including feedback related to albedo.
Maps displaying global environmental data (specifically Solar Energy and Average Temperature) through …
Maps displaying global environmental data (specifically Solar Energy and Average Temperature) through the course of a year are compared in order to understand how the Earth works as a system focusing on Polar Regions. Students then explore data from schools located in Alaska and Antarctica to understand processes that drive the temperature patterns; students then visit the National Snow and Ice Data Center Web site to learn more about the Cryosphere (focusing on Albedo and Sea Ice); finally students visit NOAA's web site looking at data of Sea Ice data anomalies. (Link to the relevant pages in these web sites are listed below.)
(Note: this resource was added to OER Commons as part of a batch upload of over 2,200 records. If you notice an issue with the quality of the metadata, please let us know by using the 'report' button and we will flag it for consideration.)
This is a quick (~25 min) classroom activity designed to stimulate thinking …
This is a quick (~25 min) classroom activity designed to stimulate thinking about sea ice, climate change, and differences between Arctic and Antarctic conditions.
(Note: this resource was added to OER Commons as part of a batch upload of over 2,200 records. If you notice an issue with the quality of the metadata, please let us know by using the 'report' button and we will flag it for consideration.)
In this unit, students will explore the causes of sea level rise …
In this unit, students will explore the causes of sea level rise and will examine short and long-term trends using sea level rise data. In addition, they will learn about the impacts to low-lying coastal communities and they will explore mitigation strategies. Finally, students will deepen their understanding of sea level rise by writing arguments focused on impacted communities and possible solutions.
This very short video introduces the concept of sea level rise and …
This very short video introduces the concept of sea level rise and ties it back to global warming. The video is brief, basic, and clear. It can be used for a quick introduction, but nothing deeper than that.
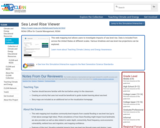
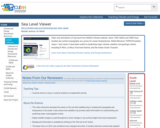
This web mapping tool allows users to investigate impacts of sea level …
This web mapping tool allows users to investigate impacts of sea level rise. Data is included from across the United States at different scales. Various timelines and sea level rise projections can be explored.
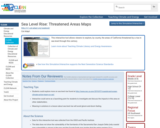
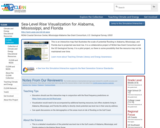
This is an interactive map that illustrates the scale of potential flooding …
This is an interactive map that illustrates the scale of potential flooding in Alabama, Mississippi, and Florida due to projected sea level rise. It is a collaborative project of NOAA Sea Grant Consortium and the US Geological Survey. It is a pilot project, so there is some possibility that the resource may not be maintained over time.
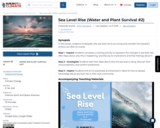
SYNOPSIS: In this lesson, students investigate why sea level rise is occurring …
SYNOPSIS: In this lesson, students investigate why sea level rise is occurring and consider how people’s actions can alter its course.
SCIENTIST NOTES: This lesson allows students to observe and measure the mean sea level, analyze the changes in the sea level, and convey the analysis using arts and painting. It improves their interdisciplinary skills and enables them to develop local strategies to respond to sea level rise impacts on their environment. All materials and videos have been reviewed and have passed the science credibility review.
POSITIVES: -Students work collaboratively to collect and report their observations. -This lesson features hands-on interaction with students’ predictions in order to dissipate misconceptions. -Students learn how art can be a powerful motivator for change. -Students collect data and build science practice skills.
ADDITIONAL PREREQUISITES: -This is lesson 2 of 4 in our K-2nd grade Water and Plant Survival unit. -You will need to assemble a number of materials to set up the stations. A list of supplies and directions is provided in the Station Directions document. -You will need ice for a number of stations. Remember to plan ahead in order to freeze it! -Station 4 (optional) must be run by an adult because it uses boiling water. Alternatively, you can do the experiment from Station 4 as a demonstration in front of the whole class.
DIFFERENTIATION: -You can set up the stations in the classroom or outside. -There are two versions of the Observation Journal, one with more room to write and the other with more room to sketch. Choose the one that is best for your students. -All of the stations can be completed as whole group demonstrations. -Possible extension: Ask students to consider how to test their ideas from the Inquire section. Try some of their ideas and discuss if the results proved or disproved their hypothesis.
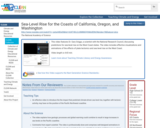
This video features Dr. Gary Griggs, a scientist with the National Research …
This video features Dr. Gary Griggs, a scientist with the National Research Council, discussing predictions for sea-level rise on the West Coast states. The video includes effective visualizations and animations of the effects of plate tectonics and sea level rise on the West Coast.
Video and animations of sea level from NASA's Climate website. Since 1992, …
Video and animations of sea level from NASA's Climate website. Since 1992, NASA and CNES have studied sea surface topography as a proxy for ocean temperatures. NASA Missions TOPEX/Poseidon, Jason 1 and Jason 2 have been useful in predicting major climate, weather, and geologic events including El Nino, La Nina, Hurricane Katrina, and the Indian Ocean Tsunami.
This short NASA video focuses on the Aquarius satellite, which was launched …
This short NASA video focuses on the Aquarius satellite, which was launched in 2011 to observe how variations in ocean salinity relate to climatic changes. By measuring salinity globally, Aquarius shows the ocean's role in climate change and climate's effects on ocean circulation.
In this worksheet-based activity, students review global visualizations of incoming sunlight and …
In this worksheet-based activity, students review global visualizations of incoming sunlight and surface temperature and discuss seasonal change. Students use the visualizations to support inquiry on the differences in seasonal change in the Northern and Southern Hemispheres and how land and water absorb and release heat differently. The activity culminates in an argument about why one hemisphere experiences warmer summers although it receives less total solar energy.
Faced with an increased chance for heavy precipitation and flooding, an emergency …
Faced with an increased chance for heavy precipitation and flooding, an emergency manager in Oregon spread the word, encouraging groups to be prepared.
This resource is a video abstract of a research paper created by …
This resource is a video abstract of a research paper created by Research Square on behalf of its authors. It provides a synopsis that's easy to understand, and can be used to introduce the topics it covers to students, researchers, and the general public. The video's transcript is also provided in full, with a portion provided below for preview:
"Obtaining sufficient nutrients is a fundamental challenge for most animals. The availability and nutritional content of food can vary in response to changes in climate and geography, and nutritional demands can vary during life events such as growth and reproduction. Of the many ways that animals have evolved to cope with these demands, one has gained increasing attention. The gut microbiome helps to break down and ferment plant carbohydrates, making it a potentially important player in nutrient availability. A new study sought to evaluate the environmental drivers of gut microbial diversity by generating the largest wild nonhuman primate gut microbiome dataset. Using 758 samples from wild Ethiopian geladas, which live in an extreme environment with limited food quality, researchers tested how proxies of food availability (rainfall) and thermoregulatory stress (temperature) affected the gut microbiome..."
The rest of the transcript, along with a link to the research itself, is available on the resource itself.
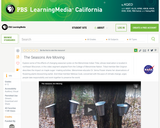
In this video segment adapted from the College of Menominee Nation, tribal …
In this video segment adapted from the College of Menominee Nation, tribal members share examples of how seasons are changing, and how these changes are affecting local plants.
An interactive that illustrates the relationships between the axial tilt of the …
An interactive that illustrates the relationships between the axial tilt of the Earth, latitude, and temperature. Several data sets (including temperature, Sun-Earth distance, daylight hours) can be generated.
An interactive simulation of Earth's seasonal dynamics that includes the axial tilt …
An interactive simulation of Earth's seasonal dynamics that includes the axial tilt and other aspects of Earth's annual cycle. This is part of a larger lab from the University of Nebraska at Lincoln: http://astro.unl.edu/naap/motion1/motion1.html
No restrictions on your remixing, redistributing, or making derivative works. Give credit to the author, as required.
Your remixing, redistributing, or making derivatives works comes with some restrictions, including how it is shared.
Your redistributing comes with some restrictions. Do not remix or make derivative works.
Most restrictive license type. Prohibits most uses, sharing, and any changes.
Copyrighted materials, available under Fair Use and the TEACH Act for US-based educators, or other custom arrangements. Go to the resource provider to see their individual restrictions.