An in-class activity for connecting earthquake magnitude, shaking, and intensity. (Note: this …
An in-class activity for connecting earthquake magnitude, shaking, and intensity.
(Note: this resource was added to OER Commons as part of a batch upload of over 2,200 records. If you notice an issue with the quality of the metadata, please let us know by using the 'report' button and we will flag it for consideration.)
(How) have public attitudes about work and gender changed over the last …
(How) have public attitudes about work and gender changed over the last 25 years? Using the General Social Survey (available online) students will conduct a descriptive statistical analysis of Americans perceptions about women and work from 1988. They will then contextualize their findings within the contemporary literature about these issues.
Advertisers constantly thrust quantitative information in our face. Product claims, store enticements, …
Advertisers constantly thrust quantitative information in our face. Product claims, store enticements, health benefits, and scores of other contexts use short quantitative arguments to catch a reader's eye (and possibly money). This example shows how one can use these ads to bring added content to a quantitative reasoning course.
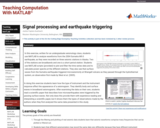
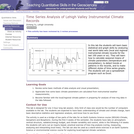
Seismograms of the 2004 M9.0 Sumatra earthquake, as recorded on station WANC …
Seismograms of the 2004 M9.0 Sumatra earthquake, as recorded on station WANC on Wrnagell volcano, Alaska. The red signal shows the raw data and the blue represented data that have been lowpass filtered. The red spikes near 2800 s are local microearthquakes triggered by the passing of the surface waves.
Provenance: Jackie Caplan-Auerbach, Western Washington University Reuse: This item is offered under a Creative Commons Attribution-NonCommercial-ShareAlike license http://creativecommons.org/licenses/by-nc-sa/3.0/ You may reuse this item for non-commercial purposes as long as you provide attribution and offer any derivative works under a similar license.
In this exercise, written for an undergraduate seismology class, students use MATLAB to analyze waveforms from the 2004 Sumatra M9.0 earthquake, as they were recorded on three seismic stations in Alaska. Two of the stations are broadbands and one is a short period station. Students use MATLAB scripts (provided) to plot and filter the time series data and to calculate power spectra at the different stations. They also see that surface waves from the Sumatra earthquake triggered microseismicity at Wrangell volcano as they passed through the hydrothermal system, an observation first made by West et al. (2005).
To view this video please enable JavaScript, and consider upgrading to a web browser that supports HTML5 video
Click to watch Jackie Caplan-Auerbach discuss her activity or watch the full webinar.
In doing this exercise students learn how the type of instrument and the instrument response affect the appearance of a seismogram. They identify body and surface waves in broadband seismograms. After examining the data on their own, students read a scientific paper that describes how microearthquakes were triggered by the passing surface waves. Not only does this provide them with experience reading and interpreting a scientific paper, but it shows them the types of observations made by the authors when they first analyzed the same data presented in this study.
(Note: this resource was added to OER Commons as part of a batch upload of over 2,200 records. If you notice an issue with the quality of the metadata, please let us know by using the 'report' button and we will flag it for consideration.)
In this activity, students will determine whether there is a statistically significant …
In this activity, students will determine whether there is a statistically significant difference in the number of watts of power produced on individual solar panels at Bryn Mawr College.
(Note: this resource was added to OER Commons as part of a batch upload of over 2,200 records. If you notice an issue with the quality of the metadata, please let us know by using the 'report' button and we will flag it for consideration.)
Sonar technology allowed scientists to produce high-resolution maps of the sea floor …
Sonar technology allowed scientists to produce high-resolution maps of the sea floor for the first time. This sonar demonstration uses a Human Sound Wave to image the "sea floor" in a lecture hall. In doing so, students can see two-way travel times collected and plotted in real time. Students also evaluate sources of error that can be applied to a real sonar device.
(Note: this resource was added to OER Commons as part of a batch upload of over 2,200 records. If you notice an issue with the quality of the metadata, please let us know by using the 'report' button and we will flag it for consideration.)
Learning about complexities carbon stabilization firsthand with the Princeton University Carbon Mitigation …
Learning about complexities carbon stabilization firsthand with the Princeton University Carbon Mitigation Initiave's Sabilization Wedges Game
(Note: this resource was added to OER Commons as part of a batch upload of over 2,200 records. If you notice an issue with the quality of the metadata, please let us know by using the 'report' button and we will flag it for consideration.)
This activity is part of the community collection of teaching materials on …
This activity is part of the community collection of teaching materials on climate and energy topics. These materials were submitted by faculty as part of the CLEAN Energy Workshop, held in April, 2011.
(Note: this resource was added to OER Commons as part of a batch upload of over 2,200 records. If you notice an issue with the quality of the metadata, please let us know by using the 'report' button and we will flag it for consideration.)
In these open-ended but simple activities, students use basic mathematics and descriptive …
In these open-ended but simple activities, students use basic mathematics and descriptive statistics to analyze campus sustainability efforts.
(Note: this resource was added to OER Commons as part of a batch upload of over 2,200 records. If you notice an issue with the quality of the metadata, please let us know by using the 'report' button and we will flag it for consideration.)
This is an activity that uses the spreadsheet program Excel to explore …
This is an activity that uses the spreadsheet program Excel to explore the origins of subsidence in New Orleans. There are two versions. The first is a traditional Spreadsheets Across the Curriculum (SSAC) module that couples a PowerPoint presentation with an embedded Excel spreadsheet where students construct a spreadsheet, and then submit the Excel file for grading. The second is a macro-enabled Excel spreadsheet that provides automatic feedback to answers and calculates the score. Upon completion the students are given a code that encrypts their spreadsheet score and then take a follow-up quiz that probes their understanding.
(Note: this resource was added to OER Commons as part of a batch upload of over 2,200 records. If you notice an issue with the quality of the metadata, please let us know by using the 'report' button and we will flag it for consideration.)
Students use STELLA to create a model of heatflow in permafrost to …
Students use STELLA to create a model of heatflow in permafrost to attempt to replicate the findings of Lachenbruch and Marshall (1986), who used inflections in the geothermal gradient of Alaskan permafrost to search for evidence of climatic change.
(Note: this resource was added to OER Commons as part of a batch upload of over 2,200 records. If you notice an issue with the quality of the metadata, please let us know by using the 'report' button and we will flag it for consideration.)
Students will have been exposed to the concept of theoretical morphospace in …
Students will have been exposed to the concept of theoretical morphospace in class prior to undertaking the lab. When introducing the lab exercise, the basic algorithm for stochastic growth is presented and students are walked through how to run the program (it is interactive). After they have completed all the exercises, they are asked to use their virtual stromatoporoid sponges as the basis for interpreting a set of real specimens.
(Note: this resource was added to OER Commons as part of a batch upload of over 2,200 records. If you notice an issue with the quality of the metadata, please let us know by using the 'report' button and we will flag it for consideration.)
This homework assignment gives students first-hand experience with thermobarometric calculations. Because many …
This homework assignment gives students first-hand experience with thermobarometric calculations. Because many of my students are math challenged, I give them a choice of solving the equations by hand or with Excel. They must first look at mineral compositions and make predictions regarding relative pressures, then calculate conditions for two sets of compositions, and finally use the P-T results to evaluate a tectonic hypothesis. The "thinking" questions are very open ended and can involve discussion of diffusion, heat flow, and tectonic settings.
(Note: this resource was added to OER Commons as part of a batch upload of over 2,200 records. If you notice an issue with the quality of the metadata, please let us know by using the 'report' button and we will flag it for consideration.)
Students are introduced to the use of linear algebra in an intuitive …
Students are introduced to the use of linear algebra in an intuitive and accessible way, through classroom activity and homework set. The familiar three-point problem is cast in terms of three dimensional analytic geometry, fostering understanding of mathematical models for simple geometric forms.
(Note: this resource was added to OER Commons as part of a batch upload of over 2,200 records. If you notice an issue with the quality of the metadata, please let us know by using the 'report' button and we will flag it for consideration.)
In this lab activity the students will learn basic statistical and graph …
In this lab activity the students will learn basic statistical and graph skills by analyzing real world climate data sets.
(Note: this resource was added to OER Commons as part of a batch upload of over 2,200 records. If you notice an issue with the quality of the metadata, please let us know by using the 'report' button and we will flag it for consideration.)
An in class demonstration of the vastness of geologic time using a …
An in class demonstration of the vastness of geologic time using a 1000-roll sheet of toilet paper and unrolling it around the room.
(Note: this resource was added to OER Commons as part of a batch upload of over 2,200 records. If you notice an issue with the quality of the metadata, please let us know by using the 'report' button and we will flag it for consideration.)
This is a teaching module presenting an introduction to modeling ground water …
This is a teaching module presenting an introduction to modeling ground water pollution, directed to undergraduate students in applied mathematics. It begins with a brief discussion of Darcy's law concerning the flow of a fluid through a porous medium. A mathematical model that uses field data to track ground-water contamination is presented. Students working with the module will write a MATLAB script to obtain a numerical solution of the model and apply it to investigate a real event of groundwater pollution.
Students come to this activity familiar with the basic assumptions of plate …
Students come to this activity familiar with the basic assumptions of plate tectonics. Using a Google Earth platform showing commonly accepted lithospheric plate boundaries as well as locations of GPS stations, students form a hypothesis about motions expected across a particular boundary. They then set about testing their hypotheses by plotting motion vectors using two independent methods.
METHOD 1: LONG-TERM "MODEL" RATES OF PLATE MOTION Students use a "Plate Motion Calculator" to determine "model" rates of plate motion averaged over millions of years.
METHOD 2: GPS MEASUREMENTS INTERPRETED IN TERMS OF PLATE MOTION Students interpret GPS data as near real-time rates of plate motion. RESULTS Students find that in general, plate tectonic theory holds up. However, they also discover sophisticated detail -- rates are not constant, internal deformation of plates does occur and some boundaries are "wider" than others. Student evaluations of the activity demonstrate that they feel engaged and empowered as they work with authentic data, and gain a sophisticated understanding of a fundamental theory as well as the process of doing science.
(Note: this resource was added to OER Commons as part of a batch upload of over 2,200 records. If you notice an issue with the quality of the metadata, please let us know by using the 'report' button and we will flag it for consideration.)
This is an activity about transport of sediment contaminated by copper, arsenic, …
This is an activity about transport of sediment contaminated by copper, arsenic, and other heavy metals that was deposited into the Clark Fork River channel as the result of historical mining activity. The Clark Fork River between Butte and Milltown, Montana has been the focus of several large superfund projects designed to address the impacts of this legacy of mining in the watershed. This activity is used in an introductory physical geology lab (primarily non-majors) with students who may have limited experience working with quantitative analysis and analyzing graphs.
(Note: this resource was added to OER Commons as part of a batch upload of over 2,200 records. If you notice an issue with the quality of the metadata, please let us know by using the 'report' button and we will flag it for consideration.)
Students learn about tsunami vertical evacuation structures (TVES) as a viable solution …
Students learn about tsunami vertical evacuation structures (TVES) as a viable solution for communities with high ground too far away for rapid evacuation. Students then apply basic design principles for TVES and make their own scale model that they think would fit will in their target community. Activity has great scope for both technical and creative design as well as practical application of math skills. Examples are from the Pacific Northwest, USA's most tsunami-vulnerable communities away from high ground, but it could be adapted to any region with similar vulnerability.
(Note: this resource was added to OER Commons as part of a batch upload of over 2,200 records. If you notice an issue with the quality of the metadata, please let us know by using the 'report' button and we will flag it for consideration.)
Bonnie Magura (Portland Public Schools), Roger Groom (Mt Tabor Middle School), and CEETEP (Cascadia EarthScope Earthquake and Tsunami Education Program)
No restrictions on your remixing, redistributing, or making derivative works. Give credit to the author, as required.
Your remixing, redistributing, or making derivatives works comes with some restrictions, including how it is shared.
Your redistributing comes with some restrictions. Do not remix or make derivative works.
Most restrictive license type. Prohibits most uses, sharing, and any changes.
Copyrighted materials, available under Fair Use and the TEACH Act for US-based educators, or other custom arrangements. Go to the resource provider to see their individual restrictions.