North American ecosystems have fundamentally changed over the late Pleistocene and Holocene; …
North American ecosystems have fundamentally changed over the late Pleistocene and Holocene; from a system dominated by mammoths, to bison, to domestic livestock. Given the very different body size and herd formation of these 'ecosystem engineers', it is likely that animals influence soil structure, water tables, vegetation and other animals in the ecosystems. What has been the ecological influence of the continued 'downsizing' of the largest animals in the ecosystem?
(Note: this resource was added to OER Commons as part of a batch upload of over 2,200 records. If you notice an issue with the quality of the metadata, please let us know by using the 'report' button and we will flag it for consideration.)
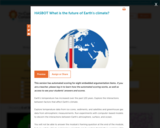
In this lesson, students will first participate in a chalk talk to …
In this lesson, students will first participate in a chalk talk to elicit initial ideas about climate and Antarctica and the types of data scientists collect. Next, they will explore images of Antarctica and make initial noticings and wonderings about what they’re seeing. Students will be introduced to important vocabulary through matching terms to components or features of a satellite image. Finally, students will synthesize their initial ideas about how satellite imagery can help us understand climate change in Antarctica. This is the first lesson of a five-part curriculum about Antarctic physical environments and ecosystems.
Biopower is electricity generated from renewable organic materials, such as plants and …
Biopower is electricity generated from renewable organic materials, such as plants and animals. Different countries rely on various biomass sources, including sugarcane, trees, and municipal waste, to produce biopower. However, the impact of biopower on climate change is complex. Despite being initially perceived as carbon neutral, the use of fossil fuels in bioenergy systems and the land requirements for biomass production can have significant environmental consequences.
This activity is a hands-on guided inquiry activity designed to highlight the …
This activity is a hands-on guided inquiry activity designed to highlight the role of an ice shelf on slowing the movement of continental ice sheets in Antarctica. Students build a model of Antarctica and both continental glaciers and ice shelves using paper models of the land and slime for glaciers and ice. Students use their model to explore the impact of recent and potential ice shelf melting and break-up.
In this resource, students watch a 2-minute video explaining albedo. The video …
In this resource, students watch a 2-minute video explaining albedo. The video shows visualizations of albedo across Earth and how it can change. Students will interpret the images in the video and answer questions about albedo.
This video provides a good overview of ice-albedo feedback. Albedo-Climate feedback is …
This video provides a good overview of ice-albedo feedback. Albedo-Climate feedback is a positive feedback that builds student understanding of climate change.
This lesson explores climate data at local, national, and global levels to …
This lesson explores climate data at local, national, and global levels to determine that temperatures are changing all over the world, and that there are certain locations where temperatures are warming faster than the global average.
This activity introduces the concept of weather. Students follow the first stages …
This activity introduces the concept of weather. Students follow the first stages of the scientific process to investigate the four factors that contribute to making weather what it is.
In this interactive activity students will create a very simple climate model. …
In this interactive activity students will create a very simple climate model. They use worksheets, chips/tokens, and follow rules for heat exchange. The activity only models temperature but there are instructions for adaptations of the model, such as rule changes for an atmosphere with increased levels of CO2.
In this activity students build a model of a watershed to learn …
In this activity students build a model of a watershed to learn where water goes when it rains. Students then make predictions and draw what they observe.
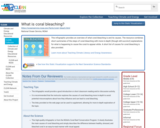
This infographic provides an overview of what coral bleaching is and its …
This infographic provides an overview of what coral bleaching is and its causes. The resource combines short summaries of the steps of coral bleaching with more in-depth (though still succinct) explanations for what is happening to cause the coral to appear white. A short list of causes for coral bleaching is also provided.
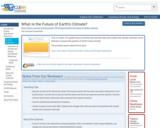
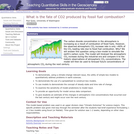
This is a series of 5 guided-inquiry activities that examine data and …
This is a series of 5 guided-inquiry activities that examine data and models that climate scientists use to attempt to answer the question of Earth's future climate.
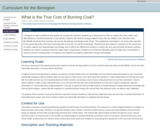
This activity is a framework for general chemistry students to explore the …
This activity is a framework for general chemistry students to explore the costs, ethics and alternatives to coal-fired electricity.
(Note: this resource was added to OER Commons as part of a batch upload of over 2,200 records. If you notice an issue with the quality of the metadata, please let us know by using the 'report' button and we will flag it for consideration.)
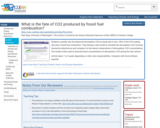
Students consider why the observed atmospheric CO2 increase rate is only ~60% …
Students consider why the observed atmospheric CO2 increase rate is only ~60% of the CO2 loading rate due to fossil fuel combustion. They develop a box-model to simulate the atmospheric CO2 increase during the industrial era and compare it to the historic observations of atmospheric CO2 concentrations. The model is then used to forecast future concentrations of atmospheric CO2 during the next century.
A box model is used to simulate the build up of carbon …
A box model is used to simulate the build up of carbon dioxide in the atmosphere during the industrial era and predict the future increase in atmospheric CO2 levels during the next century.
(Note: this resource was added to OER Commons as part of a batch upload of over 2,200 records. If you notice an issue with the quality of the metadata, please let us know by using the 'report' button and we will flag it for consideration.)
Earth's temperature has increased over the past 120 years. Explore the interactions …
Earth's temperature has increased over the past 120 years. Explore the interactions between factors that affect Earth's climate. Explore temperature data from ice cores, sediments, and satellites and greenhouse gas data from atmospheric measurements. Run experiments with computer-based models to discern the interactions between Earth's atmosphere, surface, and ocean. You will not be able to answer the module's framing question at the end of the module, but you will be able to explain how scientists can be certain that Earth is warming while not being entirely certain about how much Earth will warm.
Students act out 4 different molecules (nitrogen, oxygen, carbon dioxide and water …
Students act out 4 different molecules (nitrogen, oxygen, carbon dioxide and water vapor) to discover which ones are greenhouse gases and which ones are not.
No restrictions on your remixing, redistributing, or making derivative works. Give credit to the author, as required.
Your remixing, redistributing, or making derivatives works comes with some restrictions, including how it is shared.
Your redistributing comes with some restrictions. Do not remix or make derivative works.
Most restrictive license type. Prohibits most uses, sharing, and any changes.
Copyrighted materials, available under Fair Use and the TEACH Act for US-based educators, or other custom arrangements. Go to the resource provider to see their individual restrictions.