
Conditional Remix & Share Permitted
CC BY-NC
- Subject:
- Life Science
- Physical Science
- Material Type:
- Module
- Author:
- Erin Owens
- Date Added:
- 05/11/2021


At the University of Nebraska at Omaha, we have involved students in introductory Geology and Chemistry classes in an interdisciplinary study of drinking water quality. The goals of this project are to introduce the students to the scientific method, get them to actually "do" relevant science, and show how science affects their lives. We have also used this exercise to help some students overcome their fear of science by allowing them to actively learn science, rather than absorb it in a passive fashion.
(Note: this resource was added to OER Commons as part of a batch upload of over 2,200 records. If you notice an issue with the quality of the metadata, please let us know by using the 'report' button and we will flag it for consideration.)
Spreadsheets Across the Curriculum module/Geology of National Parks course. Students estimate travel times and costs of a driving/camping trip to visit national parks in the Colorado Plateau.
(Note: this resource was added to OER Commons as part of a batch upload of over 2,200 records. If you notice an issue with the quality of the metadata, please let us know by using the 'report' button and we will flag it for consideration.)
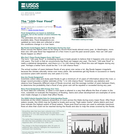
This site describes how and when 100-year floods occur. It states that flood designations are based on statistical averages, not on the number of years between big floods. It also suggests that it would make more sense to refer to 100-year floods as 1-in-100 chance floods. This resource is a United States Geological Survey (USGS) Fact Sheet. It can be used in teaching quantitative skills.
Before class, students complete a homework assignment that familiarizes them with accessing and downloading Mars THEMIS images and in which they download images of normal faults in the Ceraunius Fossae of northern Tharsis. In class, I start with a short discussion about how THEMIS images are obtained, why the images are in strips, what resolution means, and so on. Students then examine their Mars images and identify normal fault features. Students determine the range of graben widths and then calculate throw for one fault using shadow width to calculate graben depth. Students then calculate heave for the same fault, assuming a fault dip of 60Â. Students then do a back-of-the-envelope calculate to estimate crustal extension along a line across several graben. Students finish the activity by considering the impact of their assumptions on their results and evaluate the validity of their back-of-the-envelope calculation of extension. At the very end, we look at research results from several studies that have carefully calculated extension in Ceraunius Fossae.
(Note: this resource was added to OER Commons as part of a batch upload of over 2,200 records. If you notice an issue with the quality of the metadata, please let us know by using the 'report' button and we will flag it for consideration.)
Students and faculty participate in an integrated effort to characterize hydrologic relationships using hydrologic, geologic & geophysical data
(Note: this resource was added to OER Commons as part of a batch upload of over 2,200 records. If you notice an issue with the quality of the metadata, please let us know by using the 'report' button and we will flag it for consideration.)
These “Lecture Tutorials” are designed as illustrative review of individual lectures, followed with a series of questions aimed at addressing student misconceptions. 'Think Deeper' sections Foster personal connections to subject matter, and promote discussion. The general idea is that you lecture for 15-20 minutes, the students work through the lecture tutorials for 15-20 minutes, then the class discusses the answers together. These offer a consistent active learning formative assessment, and also act as study guides for students.
The goal of long-term laboratory projects is to allow students to apply newly learned concepts and methods to real-world problems and thereby add value to the laboratory learning experience. Effective projects are those that are carefully planned, have clearly defined learning objectives and reasonable workload and final product expectations. Exercises vary in length and content depending upon learning goals, class size, available resources, methodology and scheduling concerns (e.g. beginning or end of course, available class time or time of year). Each project begins with an introduction in which a geological question is posed and students are presented with background information, published reference material and guidelines for effective scientific writing.
The introductory presentations are followed by group discussions to formulate the hypothesis(es) to be tested and determine the experimental design, with due consideration to the constraints listed above. It is important that students understand their individual responsibilities and their role in the larger group effort. In the following weeks, students are provided with the materials and methods they need to conduct each phase of the project. Students collect and process their own data whenever possible. Preferably this phase involves field description and collection of samples for later lab analysis but previously collected sediment or rock cores or samples may also be used. Data analysis is a class-wide effort with each student or student team contributing a component to a larger class-wide database. Workload expectations must be clearly defined and students must conform to a tight timeframe during the analysis portion of the exercise so that the final database is complete and available on schedule. Interim deadlines for data components generally help students stay on schedule during this phase. Data synthesis and final report preparation are individual efforts. Students are encouraged to be creative in the interpretation and presentation of their results but are warned not to draw conclusions that cannot be supported by their data.
Examples of long-term projects that have been used for sedimentology at SUNY Plattsburgh include:
Particle shape analysis of beach and fluvial gravel in the Champlain Valley
Provenance of glacial till in the Champlain Valley and northeastern Adirondack Mountain region
Sedimentology, stratigraphy and landslide susceptibility of proglacial lake and marine deposits on the Lake Champlain lakeshore in Plattsburgh, NY
Sedimentology and stratigraphy of the Potsdam Sandstone in the Champlain Valley
Sedimentological evidence for breakout floods in proglacial lake and marine deposits in the Champlain Valley
(Note: this resource was added to OER Commons as part of a batch upload of over 2,200 records. If you notice an issue with the quality of the metadata, please let us know by using the 'report' button and we will flag it for consideration.)

Learn how plate tectonics plays a critical role in shaping the onshore and offshore terrain around La Jolla.Ę Dr. Neal Driscoll will present new offshore data illustrating the interplay between sediments, tectonics and sea level. (56 minutes)
This activity describes one-day field trips for introductory Physical Geology or Environmental Geology courses that are designed around a central environmental theme (e.g., air quality, water quality, economic development, environmental justice, etc.) and visit urban locations (e.g., hazardous waste sites, solid and liquid waste disposal sites, brownfield redevelopment sites, industrial complexes, or sites with ongoing environmental restoration efforts). Students are provided with a guidebook containing one-page description of each stop on the trip, along with a list of questions to stimulate discussion among students and faculty. The guidebook gives students food for thought during the bus ride to each site, preparing them to formulate their own questions for our guides at each stop. The guidebook also serves as a tangible reminder of the trip for each student to take away and potentially discuss with other students or family members. Finally, the one-page summaries from the guidebook can also be used by course instructors as handouts or PowerPoint slides to tie field trip experiences into classroom instruction and discussion. Uses online and/or real-time data Addresses student fear of quantitative aspect and/or inadequate quantitative skills Uses geophysics to solve problems in other fields
(Note: this resource was added to OER Commons as part of a batch upload of over 2,200 records. If you notice an issue with the quality of the metadata, please let us know by using the 'report' button and we will flag it for consideration.)
Brief three-line description of the activity or assignment and its strengths (you will have an opportunity to expand on this description later in the form):
This exercise is designed to investigate continuous GPS data from sites around Pu'u'Oo. Students will analyze time series of displacement, create maps of displacement vectors and discuss implications of the data and potential as a volcano monitoring technique.Note: this exercise is currently in development and will not be implemented by the author until Spring 2011. Be aware that updates and changes may occur through this time.
Full length description:This activity is designed for freshman or sophomore level courses in Introductory Geology or Geological Hazards for non-majors. No prior math skills are assumed; the activity can be completed without prior knowledge of GPS data, volcano monitoring or Hawaiian geology. The activity can be completed in class as a lab activity or as a homework assignment. Students will complete a series of activities centered on GPS time-series data from Pu'u 'O'o. Following this activity, the VEPP site will be examined as a group in order to investigate GPS data relating to known magmatic episodes at Pu'u 'O'o.
Part 1: In-class activity (described in detail in class handout)
Examination of time series and computation of displacement and velocities.
Graphing of displacement vectors for identified time intervals and determination of actual motion vectors.
These activities are interspersed by guided questions.
Part 2: In-Class web-based evaluation of VEPP data.
Think-Pair-Share activity among whole class. Once students have looked at the Pu'u 'O'o data described in part 1 of the activity, the class as a whole will look at data corresponding to either up to the minute activity or known events in the past. Using skills they have developed in the activity, they will work in small groups to interpret the data on the fly, using the work they have done previously to guide them. This part of the activity will provide the basis for discussion and explanation of the activity over-all.
(Note: this resource was added to OER Commons as part of a batch upload of over 2,200 records. If you notice an issue with the quality of the metadata, please let us know by using the 'report' button and we will flag it for consideration.)

Often Geology students complete their degrees with little practical field experience beyond what they obtain at Field Camp. This exercise introduces students to field projects early in their studies. This introduction occurs while our Earth System History class takes a three-day field trip to St. Francois Mountains of eastern Missouri. Given a topographic map of the field area, students use their field notes to construct a cross-section and answer written questions regarding relative age, field relationships, and geologic history of the area.
(Note: this resource was added to OER Commons as part of a batch upload of over 2,200 records. If you notice an issue with the quality of the metadata, please let us know by using the 'report' button and we will flag it for consideration.)
This project is intended as a long-term (3 weeks -- 1 month) lab exercise near the end of a combined Stratigraphy/Sedimentology course. The project utilizes real world data provided by CONSOL Energy of Pittsburgh, PA, and the West Virginia Geological and Economic Survey. This project has been assigned once and is being revised. Instructions have been left somewhat vague in an attempt to force students into discovering some of the more mechanical details of this process themselves.
By the latter third of the course, students have described sedimentary rocks in detail and have constructed vertical sections of rock at several outcrops around campus. The course is moving from Sedimentology/Petrology into Stratigraphy. This project is designed to illustrate the basic principles of lithostratigraphy, which are covered concurrently in the lecture portion of the class.
The project 'unfurls' over several weeks. If students are provided with the entire project at one time they generally get overwhelmed, so the project is presented piecemeal, allowing the students to expand the project as they complete one section.
Step 1: Core description 40 feet of core from the Conemaugh Group of southwestern Pennsylvania is made available to the students. They must describe the core, define lithologic units, identify specific sedimentary structures, and construct a stratigraphic column. (Students struggle with detail versus efficiency of completion, given one full lab period (3 hours) and a week to complete the assignment, many students will get lost in the detail)
The goal is to build familiarity with the type of data available to geologists as they go about constructing maps for resource estimates. Additionally, the lithologies present in this core will be similar to those described in the geologist and drilling logs necessary to complete the next step.
Each step is evaluated independently in this step concern is primarily with identification of basic lithologies (coal, sandstone, shale, limestone).
Step 2: construction of strip logs for 25 core holes in northern West Virginia. Students are provided with a location map, logs for 25 holes, and elevation data. They must construct strip logs suitable for correlation, deciding upon scale and detail of presentation. Students are provided with a CD including the location map and a .pdf for each drill record.
The logs vary between the simplicity of driller data (60' of "blue" shale) and the detail of geologist descriptions, students must balance the detail and simplicity. Additionally, students were faced with "long" logs (i.e. greater than 500') and "short" logs (i.e. less than 100'). This turned out to be extremely difficult, some students got very lost, producing long detailed logs that left them without much time for the last two steps.
Students are again provided with a week to construct the strip logs, including the lab time for the week. Strip logs are evaluated for detail, accuracy, and utility (in many cases too much detail can be as confusing as too little).
Step 3: construction of stratigraphic cross sections. The first time this project was assigned, there was little guidance provided to students beyond "choosing logs that covered the largest stratigraphic interval." This exceeded the grasp of most students so additional guidance will be provided in the next iteration of this project. A generalized stratigraphic column illustrating the basic characteristics of the Monongahela and Conemaugh groups will be provided to assist students with recognition of the basic formations.
Students will be required to construct a stratigraphic cross section through selected wells on the west side of the project area. This cross section will demonstrate the use of marker beds and the lateral continuity of stratigraphic units.
The second cross section will run east-west onto the western flank of the Chestnut Ridge anticline. The datum for this cross section will be surface elevation. This cross section will illustrate the problems of stratigraphic correlation when combined with geological structures. The rock becomes consistently older as one proceeds towards the axis of the anticline. The prominent red beds and the absence of coals, in the eastern portion of the map area indicate the presence of the Chestnut Ridge Anticline.
Evaluation of the cross sections will be based upon the accuracy of the correlations. Students are allowed a week to produce cross sections (including lab). The stratigraphic cross section should accurately delineate the Redstone, Pittsburgh, and Sewickley coals. These occur in sequence and are fairly easy to identify. Successful completion of the east-west cross section will require identification of the approximate stratigraphic position of the Monongahela-Conemaugh contact.
Step 4: construction of isopach maps. Students are then required to identify specific coal and sandstone units within their cross sections, correlate those across the map region and construct isopach maps of those units.
This requires that the students now extend what they have learned from the previous three weeks, extend those correlations to the core holes not included in the basic stratigraphic analysis. The thickness of the coal and sandstone should be identified and isopach maps constructed.
The first iteration of this project produced problems similar to those encountered in step 3. Better guidance and evaluation of the cross sections and allowing students less input on the choice of stratigraphic units to isopach should reduce the confusion.
Step 5: (optional) Interpretation and report writing : the first iteration of this project was running concurrently with a term paper. Instead of two separate projects, an interpretive report will be required. This is still in the planning stage and has not been assigned to students.
(Note: this resource was added to OER Commons as part of a batch upload of over 2,200 records. If you notice an issue with the quality of the metadata, please let us know by using the 'report' button and we will flag it for consideration.)

LiDAR-Derived Digital Outcrops, 3D Hand Samples, Petrography, and Geochemistry
Short Description:
Classic Central Metasedimentary Belt of the Grenville outcrops are revealed in this image-dense geological reference book. Each site is complete with 3D models of outcrops, rock samples, and virtual thin sections. Geochemical data is also available for some samples. High resolution images of thin sections and more detailed descriptions are available to post-secondary instructors upon request.
Word Count: 5365
(Note: This resource's metadata has been created automatically by reformatting and/or combining the information that the author initially provided as part of a bulk import process.)
LiDAR-Derived Digital Outcrops, 3D Hand Samples, Petrography, and Geochemistry
Short Description:
Classic Central Gneiss Belt of the Grenville outcrops are revealed in this image-dense geological reference book. Each site is complete with 3D models of outcrops, rock samples, and virtual thin sections. Geochemical data is also available for some samples. High resolution images of thin sections and more detailed descriptions are available to post-secondary instructors upon request.
Word Count: 7112
(Note: This resource's metadata has been created automatically by reformatting and/or combining the information that the author initially provided as part of a bulk import process.)
Introductory geology students will use geologic data obtained from the VEPP website (tilt and seismic) to identify and interpret changes during the July 21st, 2007 eruption of Pu'u 'O'o.
(Note: this resource was added to OER Commons as part of a batch upload of over 2,200 records. If you notice an issue with the quality of the metadata, please let us know by using the 'report' button and we will flag it for consideration.)
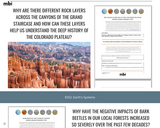
Understanding geologic time is a core idea in science that has deep connections to other areas of geology (e.g.,
plate tectonics), biology (e.g., evolution), and astronomy (e.g., planetary science). The topic, however, is
challenging for students to understand because of enormous timescale of the Earth. Therefore, students need to
make sense of the 4.6 billion year history of Earth as well as the history of life on Earth. This requires an
understanding of the depositional environments that create rock strata for us to read, relative dating ideas such
as the principle of superposition and the use of index fossils, and absolute dating techniques such as radiometric
dating. Taken together, these topics provide students not only an understanding of the history of the Earth, but
an understanding of how we have pieced this history together with multiple forms of evidence.
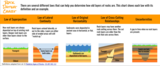
This diagram describes and illustrates the laws of relative rock dating. The laws of superposition, lateral continuity, original horizontality, cross-cutting relationships, and unconformities are represented. Definitions adapted from ck-12 Relative Ages of Rocks, CC-BY-NC 3.0