Updating search results...

Search Resources

402 Results

View
Selected filters:
  • quantitative-reasoning
Using Google Earth to measure seacliff erosion rates
Conditional Remix & Share Permitted
CC BY-NC-SA
Rating
0.0 stars

This lab uses Google Earth to measure the rate of seacliff retreat. It touches upon coastal processes, natural hazards, and coastal management issues. The central focus of the lab is in the Monterey Bay area.

(Note: this resource was added to OER Commons as part of a batch upload of over 2,200 records. If you notice an issue with the quality of the metadata, please let us know by using the 'report' button and we will flag it for consideration.)
Subject:
Biology
Life Science
Mathematics
Measurement and Data
Oceanography
Physical Science
Statistics and Probability
Material Type:
Activity/Lab
Provider:
Science Education Resource Center (SERC) at Carleton College
Provider Set:
Teach the Earth
Author:
Alfred Hochstaedter
Date Added:
12/11/2020
Using Lab Measurements to Determine the Feasibility of a Photovoltaic Panel
Conditional Remix & Share Permitted
CC BY-NC-SA
Rating
0.0 stars

Using Lab Measurements to determine the power output of a solar module and the economic feasibility of photovoltaic panels

(Note: this resource was added to OER Commons as part of a batch upload of over 2,200 records. If you notice an issue with the quality of the metadata, please let us know by using the 'report' button and we will flag it for consideration.)
Subject:
Applied Science
Biology
Engineering
Life Science
Mathematics
Measurement and Data
Statistics and Probability
Material Type:
Activity/Lab
Simulation
Provider:
Science Education Resource Center (SERC) at Carleton College
Provider Set:
Teach the Earth
Author:
Tom Termes
Date Added:
08/14/2019
Using Melting Ice to Teach Radiometric Decay
Conditional Remix & Share Permitted
CC BY-NC-SA
Rating
0.0 stars

Students are challenged to a Sherlock Holmes-style mystery in which they construct their own decay curves of melting ice to determine time-zero.

(Note: this resource was added to OER Commons as part of a batch upload of over 2,200 records. If you notice an issue with the quality of the metadata, please let us know by using the 'report' button and we will flag it for consideration.)
Subject:
Biology
Geology
Geoscience
Life Science
Mathematics
Measurement and Data
Physical Science
Statistics and Probability
Material Type:
Activity/Lab
Simulation
Provider:
Science Education Resource Center (SERC) at Carleton College
Provider Set:
Teach the Earth
Author:
Developed by Donald Wise, Franklin and Marshall College. Taken from Wise, 1990 . Related Links Radioactive Decay
Date Added:
08/25/2019
Using Methane Concentrations in Streams to Investigate for Potential Leakage of Oil and Gas Wells in Pennsylvania
Conditional Remix & Share Permitted
CC BY-NC-SA
Rating
0.0 stars

The purpose of this exercise is to guide students through the initial stages of a hypothetical water supply complaint investigation for 3 scenarios where methane has been detected in surface water in PA. This activity uses data accessible through the CUAHSI database (Shale Network (2015)) at three stream locations, and introduces three different potential sources of the observed in-stream methane. The data were collected by personnel from Penn State, the U.S. Geological Survey, and volunteers.

(Note: this resource was added to OER Commons as part of a batch upload of over 2,200 records. If you notice an issue with the quality of the metadata, please let us know by using the 'report' button and we will flag it for consideration.)
Subject:
Biology
Life Science
Mathematics
Measurement and Data
Statistics and Probability
Material Type:
Activity/Lab
Provider:
Science Education Resource Center (SERC) at Carleton College
Provider Set:
Teach the Earth
Author:
Liza Brazil
Date Added:
06/05/2019
Using Univariate Statistics to Understand Regional Drainage Patterns
Conditional Remix & Share Permitted
CC BY-NC-SA
Rating
0.0 stars

In this activity, students use MATLAB to compare two data sets of organic matter content in order to provide quantitative evidence that tests the null hypothesis that sediment samples have the same fluvial source. Students must load the data, conduct analyses, and plot the results by writing an efficient MATLAB script, and must "publish" their code to a well-organized, well-commented, .pdf document or .html file online.
After completing this exercise, students will have a better understanding of population distributions and the statistical test to distinguish two samples. They will also gain experience producing visually clear diagrams to present the results of their analysis.

(Note: this resource was added to OER Commons as part of a batch upload of over 2,200 records. If you notice an issue with the quality of the metadata, please let us know by using the 'report' button and we will flag it for consideration.)

Subject:
Biology
Life Science
Mathematics
Measurement and Data
Statistics and Probability
Material Type:
Activity/Lab
Provider:
Science Education Resource Center (SERC) at Carleton College
Provider Set:
Teach the Earth
Author:
Peter Adams
Date Added:
12/16/2020
Using the EXCEL Woburn Flow and Transport Model to Teach Modeling Concepts
Conditional Remix & Share Permitted
CC BY-NC-SA
Rating
0.0 stars

To prepare for this project / assignment, students could view the 'A Civil Action' movie, the instructor could read to them excerpts from the book and/or the trial testimony, and show them images from Woburn, wells G and H, the subsurface geologic materials, geologic cross sections, the trial participants, and the federal courtroom in Boston (see below). The materials in Bair (2001) about scientists in the courtroom, specific (excerpted) testimony presented by the three expert witnesses in the 'A Civil Action' trial, a chart summarizing the differences in their testimony, and the views of a federal judge on the goal of science versus the goal of a civil trial may also be worthwhile reading by the class prior to the assignment.

The instructor could show students the large plates included in the USGS report by Myette and others (1987) that display potentiometric data and contours before and after the critically important aquifer test performed in December 1985 and January 1986, just before the trial, and discuss the significance of the stream discharge measurement made by the USGS upstream and downstream of municipal wells G and H to the experts' testimony and the outcome of the trial.

The instructor could also show the animations of TCE movement from 1960 to 1986 from the five known sources of TCE contamination at the Woburn Wells G & H Superfund Site (W.R. Grace, UniFirst dry cleaners, Olympia Trucking, Beatrice Foods, and New England Plastics) and the animation showing temporal changes in induced infiltration from the Aberjona River to wells G and H that were created by Martin van Oort (M.S., 2005) based on the research of Maura Metheny (M.S., 1998; Ph.D., 2004) at Ohio State University.

The article by Bair and Metheny (2002) concerning the remediation activities subsequent to the famous trial at the Wells G & H Superfund Site could be used to show how groundwater contamination is cleaned up, why different remediation schemes needed to be used in different hydrogeologic settings, and why cleanup to U.S. EPA standards can take decades.

(Note: this resource was added to OER Commons as part of a batch upload of over 2,200 records. If you notice an issue with the quality of the metadata, please let us know by using the 'report' button and we will flag it for consideration.)
Subject:
Biology
Business and Communication
Hydrology
Life Science
Management
Mathematics
Measurement and Data
Physical Science
Political Science
Social Science
Statistics and Probability
Material Type:
Activity/Lab
Provider:
Science Education Resource Center (SERC) at Carleton College
Provider Set:
Teach the Earth
Author:
Scott Bair
Date Added:
08/10/2019
Using the seawater toolbox
Conditional Remix & Share Permitted
CC BY-NC-SA
Rating
0.0 stars

In this lab, students learn to use the matlab seawater toolbox and use this tool to test a number of things that I have asserted to them in class with regard to the contribution of temperature and potential temperature to density variability in the ocean.

Subject:
Geology
Mathematics
Measurement and Data
Physical Science
Statistics and Probability
Material Type:
Activity/Lab
Provider:
Science Education Resource Center (SERC) at Carleton College
Provider Set:
Teach the Earth
Author:
Alexander Stine
Date Added:
01/20/2023
Vacation! How Long and How Far? -- A Geological Circuit of National Parks in the Colorado Plateau
Conditional Remix & Share Permitted
CC BY-NC-SA
Rating
0.0 stars

Spreadsheets Across the Curriculum module/Geology of National Parks course. Students estimate travel times and costs of a driving/camping trip to visit national parks in the Colorado Plateau.

(Note: this resource was added to OER Commons as part of a batch upload of over 2,200 records. If you notice an issue with the quality of the metadata, please let us know by using the 'report' button and we will flag it for consideration.)
Subject:
Biology
Economics
Life Science
Mathematics
Measurement and Data
Social Science
Statistics and Probability
Material Type:
Activity/Lab
Provider:
Science Education Resource Center (SERC) at Carleton College
Provider Set:
Teach the Earth
Author:
Judy A McIlrath University of South Florida, Tampa Created: 2006-11-29 14:21:09 Last Modified: January 05, 2008 18:10
Date Added:
09/21/2022
Variation Diagrams and the Evolution of Thingmuli Lavas, Iceland
Conditional Remix & Share Permitted
CC BY-NC-SA
Rating
0.0 stars

In this problem set students are provided with an EXCEL spreadsheet containing major element analyses of lavas frm Thingmuli Volcano in Iceland. They are asked to construct variation diagrams (Harker plots) and then explain the trends they see for various elements. I use this problem set to introduce the use of EXCEL and to help students to think about the connections between mineral assemblage and rock chemistry.

(Note: this resource was added to OER Commons as part of a batch upload of over 2,200 records. If you notice an issue with the quality of the metadata, please let us know by using the 'report' button and we will flag it for consideration.)
Subject:
Biology
Chemistry
Life Science
Mathematics
Measurement and Data
Physical Science
Statistics and Probability
Material Type:
Activity/Lab
Data Set
Interactive
Lesson Plan
Provider:
Science Education Resource Center (SERC) at Carleton College
Provider Set:
Teach the Earth
Author:
Jeff Tepper
Date Added:
08/11/2019
Vectors and slope stability
Conditional Remix & Share Permitted
CC BY-NC-SA
Rating
0.0 stars

An in-class activity or homework for graphically solving slope-stability problems with vectors.

(Note: this resource was added to OER Commons as part of a batch upload of over 2,200 records. If you notice an issue with the quality of the metadata, please let us know by using the 'report' button and we will flag it for consideration.)
Subject:
Biology
Geoscience
Life Science
Mathematics
Measurement and Data
Physical Science
Statistics and Probability
Material Type:
Activity/Lab
Provider:
Science Education Resource Center (SERC) at Carleton College
Provider Set:
Teach the Earth
Author:
Eric Baer
Date Added:
08/26/2020
Viscosity of the Mantle: Constraints from Post-glacial Rebound
Conditional Remix & Share Permitted
CC BY-NC-SA
Rating
0.0 stars

This laboratory experiment emphasizes the exponential nature of post-glacial rebound and reinforces the relationship between the rate of rebound and the viscosity of the mantle.

(Note: this resource was added to OER Commons as part of a batch upload of over 2,200 records. If you notice an issue with the quality of the metadata, please let us know by using the 'report' button and we will flag it for consideration.)
Subject:
Biology
Geoscience
Life Science
Mathematics
Measurement and Data
Physical Science
Statistics and Probability
Material Type:
Activity/Lab
Provider:
Science Education Resource Center (SERC) at Carleton College
Provider Set:
Teach the Earth
Author:
David Kohlstedt
Date Added:
08/23/2019
Visualizing Relationships with Data: Exploring plate boundaries with Earthquakes, Volcanoes, and GPS Data in the Western U.S. & Alaska | Lessons on Plate Tectonics
Conditional Remix & Share Permitted
CC BY-NC-SA
Rating
0.0 stars

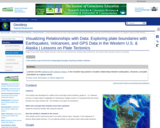
Learners use the UNAVCO GPS Velocity Viewer, or the included map packet to visualize relationships between earthquakes, volcanoes, and plate boundaries as a jigsaw activity.

(Note: this resource was added to OER Commons as part of a batch upload of over 2,200 records. If you notice an issue with the quality of the metadata, please let us know by using the 'report' button and we will flag it for consideration.)
Subject:
Biology
Life Science
Mathematics
Measurement and Data
Statistics and Probability
Material Type:
Activity/Lab
Provider:
Science Education Resource Center (SERC) at Carleton College
Provider Set:
Teach the Earth
Author:
Shelley Olds
Date Added:
08/27/2022
Visualizing Social Justice in South Seattle: Data Analysis, Race, and The Duwamish River Basin
Conditional Remix & Share Permitted
CC BY-NC-SA
Rating
0.0 stars

We examine the factors of race and environmental contamination, starting from the premise (and data proving) that race is not a biological, scientifically valid category, but a social, historical construction with real world consequences for equal access to health, resources, and power.

(Note: this resource was added to OER Commons as part of a batch upload of over 2,200 records. If you notice an issue with the quality of the metadata, please let us know by using the 'report' button and we will flag it for consideration.)
Subject:
Biology
Career and Technical Education
Environmental Studies
History
Life Science
Mathematics
Measurement and Data
Social Science
Sociology
Statistics and Probability
Material Type:
Activity/Lab
Provider:
Science Education Resource Center (SERC) at Carleton College
Provider Set:
Teach the Earth
Author:
Eunice Blavascunas, University of Washington
Date Added:
12/09/2021
Visualizing outcrop patterns from strike/dip data using MATLAB
Conditional Remix & Share Permitted
CC BY-NC-SA
Rating
0.0 stars

To view this video please enable JavaScript, and consider upgrading to a web browser that
supports HTML5 video


$( document ).ready(function() {
if(typeof videojs('flashv909742').analytics === 'function'){
videojs('flashv909742').analytics({
events: [
{
name: 'play',
label: 'video 137292',
action: 'play',
}
]
});
}
});

Click to watch Charly Bank discuss his activity or watch the full webinar.This lab activity allows students in an introductory structural geology class to explore strike-dip outcrop patterns on a map and in 3D. The topography is shown as a contour map; students decide on values for strike and a dip and select a point on the map where these would be measured. The app then shows the outcrop pattern of that plane on the map as well as a rotatable surface plot with both the topography and the plane. The activity encourages students to explore different values of strike and dip, and to work on paper and then compare their results to the model.

(Note: this resource was added to OER Commons as part of a batch upload of over 2,200 records. If you notice an issue with the quality of the metadata, please let us know by using the 'report' button and we will flag it for consideration.)
Subject:
Biology
Life Science
Mathematics
Measurement and Data
Statistics and Probability
Material Type:
Activity/Lab
Provider:
Science Education Resource Center (SERC) at Carleton College
Provider Set:
Teach the Earth
Author:
Charly Bank
Date Added:
04/07/2022
Volcanic Ejecta from Sunset Crater
Conditional Remix & Share Permitted
CC BY-NC-SA
Rating
0.0 stars

Students are provided with equations and geological data to estimate the velocities and impact effects of volcanic bombs that were ejected during the last eruption of Sunset Crater, a young cinder cone volcano in northern Arizona.

Click here to view the full activity on the KÃyah Math Project website.

(Note: this resource was added to OER Commons as part of a batch upload of over 2,200 records. If you notice an issue with the quality of the metadata, please let us know by using the 'report' button and we will flag it for consideration.)
Subject:
Biology
Geoscience
Life Science
Mathematics
Measurement and Data
Physical Science
Statistics and Probability
Material Type:
Activity/Lab
Provider:
Science Education Resource Center (SERC) at Carleton College
Provider Set:
Teach the Earth
Author:
KÃyah Math Project development team: Nancy Zumoff, Christopher Schaufele, Steven Semken, Tracy Perkins, Lynn Onken, Philippe Laval, David Gonzales, and Andrew Becenti (deceased). KÃyah Math Project directed by Steven Semken , Arizona State University; and Christopher Schaufele and Nancy Zumoff, Professors of Mathematics, Emeritus. Archived at Arizona State University School of Earth and Space Exploration.
Date Added:
09/25/2022
Volcano Monitoring with GPS: Westdahl Volcano Alaska
Conditional Remix & Share Permitted
CC BY-NC-SA
Rating
0.0 stars

Learners use graphs of GPS position data to determine how the shape of Westdahl Volcano, Alaska is changing. If the flanks of a volcano swell or recede, it is a potential indication of magma movement and changing pressures below ground. GPS can measure changes as little as a couple millimeters per year. Learners are asked to decide if the measured motions are enough to issue a warning of immediate danger.

Show more information on NGSS alignment
Hide

NGSS ALIGNMENT
Disciplinary Core Ideas
Earth' Systems: MS-ESS2-1, MS-ESS2-2, HS-ESS2-1
Earth and Human Activity: MS-ESS3-2, HS-ESS3-1
Science and Engineering Practices
4. Analyzing and Interpreting Data
5. Using Mathematics and Computational Thinking
6. Constructing Explanations and Designing Solutions
Crosscutting Concepts
2. Cause and Effect
4. Systems and System Models
7. Stability and ChangeÂ

(Note: this resource was added to OER Commons as part of a batch upload of over 2,200 records. If you notice an issue with the quality of the metadata, please let us know by using the 'report' button and we will flag it for consideration.)
Subject:
Applied Science
Biology
Engineering
Life Science
Mathematics
Measurement and Data
Statistics and Probability
Material Type:
Activity/Lab
Homework/Assignment
Provider:
Science Education Resource Center (SERC) at Carleton College
Provider Set:
Teach the Earth
Author:
Beth Pratt-Sitaula
Maite Agopian
Date Added:
09/26/2022
Volume of oceans, and sea-level variations
Conditional Remix & Share Permitted
CC BY-NC-SA
Rating
0.0 stars

The activity combines aspects of Earth science (volume of oceans and ice sheets) with calculus (area of a 1x1 degree tile) and Matlab programming. Students calculate the volume of oceans and of ice sheets given the 1x1-degree digital elevation file. They then determine how much ocean levels would rise if all is on Antarctica and Greenland were to melt. To solve this problem in Matlab entry-wise matrix multiplication, loops, selection of cells using the "ginput" command, and different visualizations (grid and contours) are useful. Conceptually students need to think about inundation of coastal areas and shifting of coastlines.

(Note: this resource was added to OER Commons as part of a batch upload of over 2,200 records. If you notice an issue with the quality of the metadata, please let us know by using the 'report' button and we will flag it for consideration.)
Subject:
Applied Science
Biology
Environmental Science
Life Science
Mathematics
Measurement and Data
Statistics and Probability
Material Type:
Activity/Lab
Provider:
Science Education Resource Center (SERC) at Carleton College
Provider Set:
Teach the Earth
Author:
Charly Bank
Date Added:
04/07/2022
Watershed Analysis of Stream Morphology
Conditional Remix & Share Permitted
CC BY-NC-SA
Rating
0.0 stars

The goal of this activity is to provide students an opportunity to analyze the stream pattern and morphometric relationships of a particular watershed. Students will use topographic map analysis and data collection, along with analysis of data using Excel to characterize their watershed.
Designed for a geomorphology course

(Note: this resource was added to OER Commons as part of a batch upload of over 2,200 records. If you notice an issue with the quality of the metadata, please let us know by using the 'report' button and we will flag it for consideration.)
Subject:
Biology
Life Science
Mathematics
Measurement and Data
Statistics and Probability
Material Type:
Activity/Lab
Provider:
Science Education Resource Center (SERC) at Carleton College
Provider Set:
Teach the Earth
Author:
Holly Dolliver
Date Added:
09/02/2020
Watershed area and discharge relationships
Conditional Remix & Share Permitted
CC BY-NC-SA
Rating
0.0 stars

Students use USGS WaterData website to find data on area, average annual discharge and response to high-precip events in small watersheds in southern New England. Data for the class are compiled to generate graphs showing the regional relationships between (1) area and discharge, and (2) area and time-lag between precip and maximum discharge.

terms: discharge, watershed, flood

(Note: this resource was added to OER Commons as part of a batch upload of over 2,200 records. If you notice an issue with the quality of the metadata, please let us know by using the 'report' button and we will flag it for consideration.)

Subject:
Hydrology
Physical Science
Material Type:
Activity/Lab
Provider:
Science Education Resource Center (SERC) at Carleton College
Provider Set:
Teach the Earth
Author:
Steven Petsch
Date Added:
09/06/2020
Waves Through Earth: Interactive Online Mac and PC
Conditional Remix & Share Permitted
CC BY-NC-SA
Rating
0.0 stars

Students vary the seismic P and S wave velocity through each of four concentric regions of Earth and match "data" for travel times vs. angular distance around Earth's surface from the source to detector.

(Note: this resource was added to OER Commons as part of a batch upload of over 2,200 records. If you notice an issue with the quality of the metadata, please let us know by using the 'report' button and we will flag it for consideration.)
Subject:
Biology
Geology
Life Science
Mathematics
Physical Science
Statistics and Probability
Material Type:
Activity/Lab
Provider:
Science Education Resource Center (SERC) at Carleton College
Provider Set:
Teach the Earth
Author:
JAVA Applet and activity provided by Visual Entities. Starting Point page organized by R.M. MacKay.
Date Added:
01/21/2022