(This case study was added to OER Commons as one of a …
(This case study was added to OER Commons as one of a batch of over 700. It has relevant information which may include medical imagery, lab results, and history where relevant. A link to the final diagnosis can be found at the end of the case study for review. The first paragraph of the case study -- typically, but not always the clinical presentation -- is provided below.)
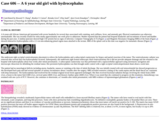
A 6-years-old African American girl presented with severe headache for several days associated with vomiting, neck stiffness, fever, and unsteady gait. Physical examination was otherwise unremarkable. She was recently treated for otitis media approximately one week prior to admission. Mother reported that the patient had frequent headaches and incontinent of bowel and bladder during the past year. A lumbar puncture showed high CSF protein but no signs of infection. Computer Tomography (CT) (Figure 1) and Magnetic Resonance Imaging (MRI) of the brain (Figure 2) showed obstructive hydrocephalus with a 2.3 cm non-enhancing pineal region mass attached to the tectum. MRI of the spinal cord at this time was negative for metastatic disease (Figure 3).
(This case study was added to OER Commons as one of a …
(This case study was added to OER Commons as one of a batch of over 700. It has relevant information which may include medical imagery, lab results, and history where relevant. A link to the final diagnosis can be found at the end of the case study for review. The first paragraph of the case study -- typically, but not always the clinical presentation -- is provided below.)
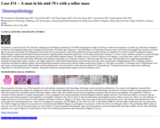
A 77-year old woman presented with progressive dizziness over several months. She also reported bilateral tinnitus, but denied headache. Physical exam revealed an unsteady, wide based gait, slow finger to nose test bilaterally, and inability to walk toes to heel. The patient had been diagnosed with mantle cell lymphoma (MCL) three years ago and she has completed six cycles of bendamustine and rituximab, followed by 2 years of rituximab maintenance therapy that was completed two months prior to onset of her symptoms. A recent bone marrow biopsy showed no evidence of residual lymphoma. MRI of the brain (Fig. 1) showed a right cerebellar lesion with central high T2 signal and peripheral rim enhancement.
(This case study was added to OER Commons as one of a …
(This case study was added to OER Commons as one of a batch of over 700. It has relevant information which may include medical imagery, lab results, and history where relevant. A link to the final diagnosis can be found at the end of the case study for review. The first paragraph of the case study -- typically, but not always the clinical presentation -- is provided below.)
The patient is a man in his mid-70's who had a subungual acral lentiginous melanoma (T3N1M0) with gangrene change of left big toe underwent amputation 15 months ago. Metastatic malignant melanoma of left inguinal lymph node was diagnosed with biopsy 14 months ago. Progressive visual disturbance was noted and a pituitary tumor was found with hypoglycemic episode one month ago. He presented to hospital with falling down with initial loss of consciousness 2 days before admission. His past medical history was significant for chronic obstructive pulmonary disease. Endocrinologic analysis showed modest hyperprolactinemia, hypothyroidism and partial insufficiency of the adrenocorticotropic hormone. CT scans of chest, abdomen and pelvis revealed enlarged lymph nodes in mediastinum, porta hepatis, para-aortic area and bilateral inguinal regions. The largest one was 18 mm in long axis at left inguina. A soft tissue mass, about 3 cm in the largest dimension, was noted at left renal hilum. Melanoma with multifocal metastasis was considered. Cranial CT showed a huge soft tissue mass with hyperdense foci suggesting hemorrhage in intrasellar and suprasellar region. Apoplexy was highly suspected. Cerebral MRI demonstrated a 62x33x49 mm soft tissue tumor occupying the enlarged pituitary fossa, extending upward to suprasellar and bilateral sublental regions, and encasing bilateral internal carotid arteries and left middle cerebral artery (Figure 1). The tumor was mainly T1-isointense and T2-hyperintense to the gray matter, and homogeneously enhanced after contrast administration. Several small foci inside the tumor bulk had T1-hyperintensity, T2-hypointensity and no enhancement, indicating composition of subacute hematoma or melanin. The patient underwent transsphenoidal surgical resection of pituitary tumor.
(This case study was added to OER Commons as one of a …
(This case study was added to OER Commons as one of a batch of over 700. It has relevant information which may include medical imagery, lab results, and history where relevant. A link to the final diagnosis can be found at the end of the case study for review. The first paragraph of the case study -- typically, but not always the clinical presentation -- is provided below.)
We present 2 cases of cerebellar mass of male infants. Case 1 is a 15-month-old male infant presented with irritability, poor oral intake and vomiting. Brain magnetic resonance (MR) imaging revealed a 5.2×4.4 cm-sized mass in the left cerebellar hemisphere. The tumor showed robust gadolinium-enhancement and a mixed solid and cystic architecture without intratumoral hemorrhage (Fig 1A). The elective tumor resection was performed through paramedian suboccipital approach. The tumor was huge and hypervascular but friable. The tumor was well-demarcated and removed totally. The patient had no additional neurological deficit postoperatively. The baby received adjuvant chemotherapy. He has lived without neurological deficit or tumor recurrence for 17 months of follow-up.
In this minds-on activity, students analyze the relationships between photosynthesis, cellular respiration, …
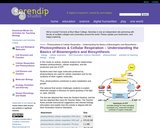
In this minds-on activity, students analyze the relationships between photosynthesis, cellular respiration, and the production and use of ATP. Students learn that sugar molecules produced by photosynthesis are used for cellular respiration and for the synthesis of other organic molecules. Thus, photosynthesis contributes to plant metabolism and growth. The optional final section challenges students to explain observed changes in biomass for plants growing in the light vs. dark. This activity helps students meet the Next Generation Science Standards.
In this exercise learners use statistics (T-test using Excel) to analyze an …
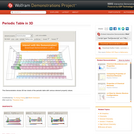
In this exercise learners use statistics (T-test using Excel) to analyze an authentic dataset from Lake Mendota in Madison, WI that spans the last 150 years to explore ice on/ice off dates. In addition, students are asked to investigate the IPCC Likelihood Scale and apply it to their statistical results.
This lesson in part of Software Carpentry workshop and teach novice programmers …
This lesson in part of Software Carpentry workshop and teach novice programmers to write modular code and best practices for using R for data analysis. an introduction to R for non-programmers using gapminder data The goal of this lesson is to teach novice programmers to write modular code and best practices for using R for data analysis. R is commonly used in many scientific disciplines for statistical analysis and its array of third-party packages. We find that many scientists who come to Software Carpentry workshops use R and want to learn more. The emphasis of these materials is to give attendees a strong foundation in the fundamentals of R, and to teach best practices for scientific computing: breaking down analyses into modular units, task automation, and encapsulation. Note that this workshop will focus on teaching the fundamentals of the programming language R, and will not teach statistical analysis. The lesson contains more material than can be taught in a day. The instructor notes page has some suggested lesson plans suitable for a one or half day workshop. A variety of third party packages are used throughout this workshop. These are not necessarily the best, nor are they comprehensive, but they are packages we find useful, and have been chosen primarily for their usability.
This video is the first of a three-video series from the Sea …
This video is the first of a three-video series from the Sea Change project. It features the field work of scientists from the US and Australia looking for evidence of sea level rise during the Pliocene era when Earth was (on average) about 2 to 3 degrees Celsius hotter than it is today.
This video is the second of a three-video series in the Sea …
This video is the second of a three-video series in the Sea Change project, which follows the work of Dr. Maureen Raymo, paleogeologist at Columbia University's Lamont-Doherty Earth Observatory, who travels with fellow researchers to Australia in search of evidence of sea level that was once higher than it is today.
In this hands-on activity, students will learn about dendrochronology (the study of …
In this hands-on activity, students will learn about dendrochronology (the study of tree rings to understand ecological conditions in the recent past) and come up with conclusions as to what possible climatic conditions might affect tree growth in their region. Students determine the average age of the trees in their schoolyard, investigate any years of poor growth, and draw conclusions about the reasons for those years.
This course is an introduction to statistical data analysis. Topics are chosen …
This course is an introduction to statistical data analysis. Topics are chosen from applied probability, sampling, estimation, hypothesis testing, linear regression, analysis of variance, categorical data analysis, and nonparametric statistics.
This visualization is a series of three short animations/videos that illustrate how …
This visualization is a series of three short animations/videos that illustrate how the changing ice sheets result in sea level rise. It uses satellite data to show how Greenland and Antarctica are losing mass at a rate of 283 gigatons per year and 145 gigatons per year, respectively. Simulation shows visualization of one gigaton and how much this translates to sea level rise.
Web Accessibility for Developers is a technical book aimed primarily at programmers. …
Web Accessibility for Developers is a technical book aimed primarily at programmers. Learn how to develop accessible interactivity on the Web and gain expertise using WAI-ARIA, a W3C specification that enables optimal use of assistive technologies, like screen readers, when navigating the Web.
Making Websites Accessible Short Description: This book accompanies the Accessibility Maze, a …
Making Websites Accessible
Short Description: This book accompanies the Accessibility Maze, a game developed to teach the basics of web accessibility for those new to the topic. Or, for anyone else who wants to see how fun learning about web accessibility can be. You should try the maze before reading this book, to get the full effect of the game.
Word Count: 4068
(Note: This resource's metadata has been created automatically by reformatting and/or combining the information that the author initially provided as part of a bulk import process.)
This classroom resource is a combination of 3 visualizations and accompanying text …
This classroom resource is a combination of 3 visualizations and accompanying text that illustrate how 3 key natural phenomena - cyclical changes in solar energy output, major volcanic eruptions over the last century, and El Nino/Nina cycles - are insufficient to explain recent global warming.
This visualization focuses on public acceptance of climate science. The set of …
This visualization focuses on public acceptance of climate science. The set of interactive maps illustrates public opinion on a variety of climate beliefs, risk perceptions, and policy support. The data is from the Yale Project on Climate Communication.
Students investigate how much greenhouse gas (carbon dioxide and methane) their family …
Students investigate how much greenhouse gas (carbon dioxide and methane) their family releases into the atmosphere each year and relate it to climate change. To address this, students use the Environmental Protection Agency Personal Emissions Calculator to estimate their family's greenhouse gas emissions and to think about how their family could reduce those emissions.
No restrictions on your remixing, redistributing, or making derivative works. Give credit to the author, as required.
Your remixing, redistributing, or making derivatives works comes with some restrictions, including how it is shared.
Your redistributing comes with some restrictions. Do not remix or make derivative works.
Most restrictive license type. Prohibits most uses, sharing, and any changes.
Copyrighted materials, available under Fair Use and the TEACH Act for US-based educators, or other custom arrangements. Go to the resource provider to see their individual restrictions.