Using real data, this animated video provides numerous facts comparing human behaviors …
Using real data, this animated video provides numerous facts comparing human behaviors and Earth characteristics related to climate change through time - from the first Earth Day in 1970, to the 50th anniversary of Earth Day in 2020.
This website is a comprehensive set of resources for students K-12, parents …
This website is a comprehensive set of resources for students K-12, parents and teachers. The topics include online security, digital relationships and cyberbullying, digital footprint, digital citizenship, student data, copyright and maintaining a healthy balance of digital exposure.
In this deep dive session, we introduce the basics of pre-registration: a …
In this deep dive session, we introduce the basics of pre-registration: a method for creating a permanent record of a research plan prior to conducting data collection and/or data analysis. We discuss the conceptual similarities and practical differences between pre-registration and registered reports and traditional approaches to educational research. We provide some practical advice from our own experiences using this practice in our own research and resources available for researchers interested in pre-registering their work. Finally, we end with questions and discussion about adopting pre-registration practices and unique considerations for implementing pre-registration in education research.
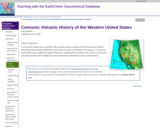
In this activity, students view a Quicktime video animation based on data …
In this activity, students view a Quicktime video animation based on data from the North American Volcanic and Intrusive Rock Database (NAVDAT) to learn about the history of volcanism in the western U.S. during the last 65 million years. Students are guided through the complex data-rich animation with a series of instructions and study questions which highlight time-space-composition relationships and link to plate tectonics.
(Note: this resource was added to OER Commons as part of a batch upload of over 2,200 records. If you notice an issue with the quality of the metadata, please let us know by using the 'report' button and we will flag it for consideration.)
students are engaged in reflecting on whether plate tectonics is a general …
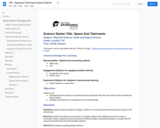
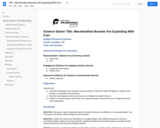
students are engaged in reflecting on whether plate tectonics is a general theory of planetary organization and evolution. Students use topographic, magnetic, spectral, and other data from NASA and ESA missions to determine whether "Earth-style" plate tectonics is functional on planets and moons elsewhere in the solar system. Students are engaged in a data-rich environment from which they must formulate and test multiple hypotheses. Throughout the process, students are engaged in small groups to identify what they need to learn to answer their questions, what resources are available to them, how best to report their findings, and how they can assess the amount of learning that is taking place.
Using a computer interactive tool, students investigate the changes in coastline that …
Using a computer interactive tool, students investigate the changes in coastline that would result from a change in sea level, and suggest what factors could cause a rise in sea level. The activity asks students to reflect on outcomes of their investigations completed during the Ice Ages and Night Life activities, all of which are part of Space Update, a collection of resources and activities provided to teach about Earth and space. Summary background information, data and images supporting the activity are available on the Earth Update data site. To complete the activity, students will need to access the Space Update multimedia collection, which is available for download and purchase for use in the classroom.
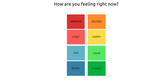
ClassMood App is a classroom tool that helps teachers create the mood …
ClassMood App is a classroom tool that helps teachers create the mood for learning. It aims to help make teaching and learning more enjoyable. It provides teachers with mood changing activities for their classroom and works toward helping students take control of their moods.
ClassMood App is applicable to multiple educational contexts from primary school to higher education. It has been developed in a collaboration with experts from neuroscience, education and learning design and tested with students from upper primary to university.
How does it work? When it’s too hot or too cold, it is hard to learn as we can’t stop thinking about how uncomfortable it is. But once we notice the temperature, we can adjust it as needed and free up space in our heads for thinking. Positive moods and states can free up space for thinking and learning. This is the concept of ClassMood App.
The technology is a responsive and free-to-use web-based tool. Teachers can simply create a mood measuring event and share the unique code with your students. Each student can anonymously select their current mood and add the cause of their mood.
The App provides teachers with real-time data via a teacher’s dashboard to identify the aggregate mood of a class and recommends classroom activities to help teachers guide learners to moods that are more conducive to learning. Activities include mindfulness breathing activities and social games involving movement.
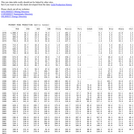
This site provides graphs that illustrate gold production for every five years …
This site provides graphs that illustrate gold production for every five years from 1970 to 2004, and gold production by country. Links are also included to quarterly mine gold and silver production data, and yearly and cumulative gold and silver production.
Students will be presented with a problem; that is to determine the …
Students will be presented with a problem; that is to determine the general characteristics (stratigraphy, water table depth) of a heterogeneous deposit (glacial till south of the MSU campus or proglacial sediments south of Ludington, MI) using electrical resistivity methods. The project consists of three separate activities: 1) use laboratory experiments to measure the relationship between soil water content and electrical resistivity for different soil samples obtained from the sites (2-3 samples per group), 2) use simple modeling software to calculate the resistivity response for simple geological models, based on information from well logs and the results of the laboratory measurements, and 3) design (min-max a-spacing and stepsize, based on the forward modeling results), execute, and analyze a field sounding experiment. Results will be summarized in a report and presented in class. Uses geophysics to solve problems in other fields
(Note: this resource was added to OER Commons as part of a batch upload of over 2,200 records. If you notice an issue with the quality of the metadata, please let us know by using the 'report' button and we will flag it for consideration.)
Chemistry Behind the Magic features videos of exciting live chemistry demonstrations. The …
Chemistry Behind the Magic features videos of exciting live chemistry demonstrations. The videos are enhanced by explanations of the science behind the demonstration, in a fun and easy-to-understand format. This set of videos showcases exciting live chemistry demonstrations held at MIT. Through the magic of chemistry, Dr. John Dolhun and Dr. Bassam Shakhashiri create things that steam, fizzle, and glow. Each video also provides a deeper look into the chemistry that makes it all possible. For teachers, we have provided supporting materials to help you understand and replicate the experiments in your own classrooms. These videos can be watched in any order. WARNING NOTICE The experiments described in these materials are potentially hazardous. Among other things, the experiments should include the following safety measures: a high level of safety training, special facilities and equipment, the use of proper personal protective equipment, and supervision by appropriate individuals. You bear the sole responsibility, liability, and risk for the implementation of such safety procedures and measures. MIT and Dow shall have no responsibility, liability, or risk for the content or implementation of any of the material presented. Legal Notice
This activity is a field investigation where students gather data on stream …
This activity is a field investigation where students gather data on stream health by collecting macro-invertebrates at three different locations and then develop an experimental question through land use and topographic map research to explain differences in water quality.
SETDA, CCSSO and Project Unicorn collaborate to improve data interoperability in schools. …
SETDA, CCSSO and Project Unicorn collaborate to improve data interoperability in schools. This first brief from their work together establishes an overview of interoperability, shares promising practices from states, and gives a call to action for state education agencies.
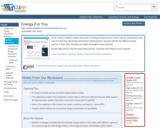
In this activity, students explore what types of energy resources exist in …
In this activity, students explore what types of energy resources exist in their state by examining a state map and data from the Energy Information Administration. Students identify the different energy sources in their state, including the state's renewable energy potential.
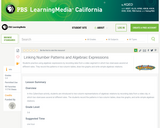
Students practice using algebraic expressions by recording data from a video segment …
Students practice using algebraic expressions by recording data from a video segment in which two staircases ascend at different rates. They record the patterns in two-column tables, draw line graphs and write simple algebraic relations.
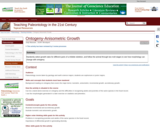
Each student receives the same simple drawing (on graph paper) of a …
Each student receives the same simple drawing (on graph paper) of a trilobite. By flipping coins, each student determines a growth rate for different parts of the trilobite exoskeleton. They then draw (to scale) a first molt stages of the trilobite by applying the growth rates to the 'juvenile' diagram. They then apply the same rates to the 'first molt' to produce an 'adult' morphology. The adult morphologies for each ontogenetic series, as well as an adult produced by purely isometric growth, are displayed for the entire class to see. These diagrams serve as the basis for class discussion.
Later in the semester, the 'adult' trilobites are used to generate a data matrix of morphologic features of related species. Students work in groups so that there are a few different data matrices for the same set of species. A cladistic analysis and a cluster analysis (phenetics) produce possible phylogenies for the data matrices. We compare the results in a class discussion.
(Note: this resource was added to OER Commons as part of a batch upload of over 2,200 records. If you notice an issue with the quality of the metadata, please let us know by using the 'report' button and we will flag it for consideration.)
This book is about using the power of computers to do things …
This book is about using the power of computers to do things with geographic data. It teaches a range of spatial skills, including: reading, writing and manipulating geographic data; making static and interactive maps; applying geocomputation to solve real-world problems; and modeling geographic phenomena. By demonstrating how various geographic operations can be linked, in reproducible ‘code chunks’ that intersperse the prose, the book also teaches a transparent and thus scientific workflow. Learning how to use the wealth of geospatial tools available from the R command line can be exciting, but creating new ones can be truly liberating. Using the command-line driven approach taught throughout, and programming techniques covered in Chapter 11, can help remove constraints on your creativity imposed by software. After reading the book and completing the exercises, you should therefore feel empowered with a strong understanding of the possibilities opened up by R’s impressive geographic capabilities, new skills to solve real-world problems with geographic data, and the ability to communicate your work with maps and reproducible code.
In this activity, students learn how to prevent exposure to the Sun's …
In this activity, students learn how to prevent exposure to the Sun's harmful ultraviolet rays. Students will systematically test various sunscreens to determine the relationship between spf (sun protection factor) value and sun exposure. At the end of the activity, students are asked to consider how this investigation could be used to help them design a new sunscreen.
No restrictions on your remixing, redistributing, or making derivative works. Give credit to the author, as required.
Your remixing, redistributing, or making derivatives works comes with some restrictions, including how it is shared.
Your redistributing comes with some restrictions. Do not remix or make derivative works.
Most restrictive license type. Prohibits most uses, sharing, and any changes.
Copyrighted materials, available under Fair Use and the TEACH Act for US-based educators, or other custom arrangements. Go to the resource provider to see their individual restrictions.