DOAB is a community-driven discovery service that indexes and provides access to …
DOAB is a community-driven discovery service that indexes and provides access to scholarly, peer-reviewed open access books and helps users to find trusted open access book publishers. All DOAB services are free of charge and all data is freely available.
ObjectivesAt the end of the lesson, students will be able to:Produce colour …
ObjectivesAt the end of the lesson, students will be able to:Produce colour patterns using given codes after creating patterns in a whole group activity with 90% accuracy.Create data for and read a pictograph after taking a class survey with 90% accuracy.Construct and solve word problems.
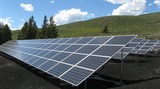
In this activity learners work in pairs or small groups to evaluate …
In this activity learners work in pairs or small groups to evaluate energy use in their school and make recommendations for improved efficiency. Students create and use an energy audit tool to collect data and present recommendations to their class. Further communication at the school and district level is encouraged.
This video segment examines the issue of climate change from the perspective …
This video segment examines the issue of climate change from the perspective of Native Americans. The video segment was adapted from a student video produced at Haskell Indian Nations University in Lawrence, Kansas.
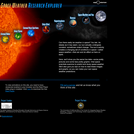
looks at how the sun creates a changing set of conditions in …
looks at how the sun creates a changing set of conditions in space. Learn about coronal holes, solar flares, coronal mass ejections, solar wind, magnetosphere, and auroras. See photos, graphs, and live data. Make your own space weather predictions.
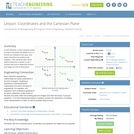
Reflection questions are offered at two levels: 1. District and school level, …
Reflection questions are offered at two levels: 1. District and school level, for system-wide reflection, appropriate for district administrators, building principals, department chairs, content lea ders, coaches 2. Teacher level, appropriate for individual teachers in considering their data/information
This activity is a field investigation where students observe and interpret the …
This activity is a field investigation where students observe and interpret the rocks types, geologic features, and processes typical to the north shore of Lake Superior. Students use their data to develop questions that could be further investigated and to predict the sequence of events leading to the formation of these rocks and features.
Learn to connect position-time and velocity-time graphs. Explore velocity using an animated …
Learn to connect position-time and velocity-time graphs. Explore velocity using an animated car icon connected to either a position-time or a velocity-time graph, or both. Then investigate other motion graphs.
Solar energy in the form of light is available to organisms on …
Solar energy in the form of light is available to organisms on Earth in abundance. Natural systems and other organisms have structures that function in ways to manage the interaction with and use of this energy. In this storyline, students will explore how light energy interacts with materials and how light energy can be transformed into energy for heating and cooling. Students design a solar water heater and explore how products like this can reduce carbon emissions to mitigate climate change.
There is a 40% chance that the lower ⅓ of the of …
There is a 40% chance that the lower ⅓ of the of the Cascadia subduction zone will rupture in the next 50 years, generating a large earthquake and ensuing tsunami. In this project, students will work collaboratively to design and test a model of a vertical evacuation structure. They will evaluate the performance of their models and propose further modifications to improve their design. Students will then make a scale drawing and a model to apply math concepts of scale to designing and creating an ideal model of a vertical evacuation structure. Finally, students will present their findings and proposed final design to their peers and an adult audience. The entire process takes about 2 weeks, and was expanded to include more information and activities with earthquake/tsunami prediction and application of scale. The unit is a great fit for standards within Earth Science (specifically plate tectonics and human mitigation) as well as Engineering and Design standards.
The Journal of Open Educational Resources in Higher Education (JOERHE) is a …
The Journal of Open Educational Resources in Higher Education (JOERHE) is a Diamond Open Access journal. The journal features content concerned with OER, Open Pedagogy, Open Access, Open Data, and similar topics focusing specifically within the context of Higher Education in the United States and Canada.
This activity identifies and explains the benefits of and threats to coral …
This activity identifies and explains the benefits of and threats to coral reef systems. Students read tutorials, describe the role of satellites, analyze oceanographic data and identify actions that can be undertaken to reduce or eliminate threats to coral reefs. As a culminating activity, students prepare a public education program.
Students prepare for this activity by working with a unidirectional flume with …
Students prepare for this activity by working with a unidirectional flume with a sand bed. We adjust water depth, flow velocity, and channel slope to achieve a range of bed states, in an effort for them to understand the controls on bedforms. This portion of the activity could be done in lecture or via another exercise that makes use of digital video of actual experiments. The activity itself is a jigsaw: students form groups of three, each group responsible for plotting depth vs. velocity plots of bedform state for a single sand grain size range (0.10-0.14 mm, 0.5-0.64 mm, and 1.3-1.8 mm). These data are provided to them as Excel files and the data were directly 'stolen' from the original depth vs. velocity plots in Middleton and Southard (1984), Mechanics of Sediment Movement, SEPM Short Course Number 3. Datathief software (available free on the web) was used to steal the data. The data are arranged in columns: depth, velocity, and bedform type. Students must plot each of the different bedform types with a different symbol, then they have to define field boundaries. It is critical that they have never seen the original plots in their textbook. The goal is for them to derive them on their own, not to regurgitate what is in their textbook or elsewhere. After they complete their plots for each grain size range, the groups re-arrange themselves into groups of three with one representative from each of the grain size groups. They then must try to evaluate the effects of changing grain size on bedform state. Finally, after completing the exercise, the bedform analysis is linked to the cross stratification that is produced under conditions of high sediment fallout rates and the given bed state. The activity gives students practice working with realistic datasets, exposure to the role of physical modeling in sedimentary geology, and a chance to plot and interpret real data. Furthermore, it really solidifies the link between cross stratification and its dynamic interpretation from the rock record.
(Note: this resource was added to OER Commons as part of a batch upload of over 2,200 records. If you notice an issue with the quality of the metadata, please let us know by using the 'report' button and we will flag it for consideration.)
To gain a better understanding of the roles and functions of components …
To gain a better understanding of the roles and functions of components of the human respiratory system and our need for clean air, students construct model lungs that include a diaphragm and chest cavity. They see how air moving in and out of the lungs coincides with diaphragm movement. Then student teams design and build a prototype face mask pollution filter. They use their model lungs to evaluate their prototypes to design requirements.
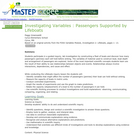
This activity is a lab investigation where students develop an investigable inquiry …
This activity is a lab investigation where students develop an investigable inquiry question, construct a fleet of boats, collect data about how many passengers (pennies) each will hold before sinking, interpret their findings, and will share methods and results during a poster session.
A brief refresher on the Cartesian plane includes how points are written …
A brief refresher on the Cartesian plane includes how points are written in (x, y) format and oriented to the axes, and which directions are positive and negative. Then students learn about what it means for a relation to be a function and how to determine domain and range of a set of data points.
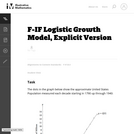
This problem introduces a logistic growth model in the concrete setting of …
This problem introduces a logistic growth model in the concrete setting of estimating the population of the U.S. The model gives a surprisingly accurate estimate and this should be contrasted with linear and exponential models, studied in ``U.S. Population 1790-1860.'' This task requires students to interpret data presented.
This lesson on snails integrates Science, Language Arts, Technology and Math. Teacher …
This lesson on snails integrates Science, Language Arts, Technology and Math. Teacher will share a fictitious snail story with students. Students will complete a K-W-L chart on snails with the help of the internet. As a related activity, students will take a poll on snail preferences and graph it.
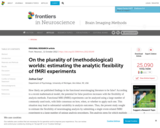
How likely are published findings in the functional neuroimaging literature to be …
How likely are published findings in the functional neuroimaging literature to be false? According to a recent mathematical model, the potential for false positives increases with the flexibility of analysis methods. Functional MRI (fMRI) experiments can be analyzed using a large number of commonly used tools, with little consensus on how, when, or whether to apply each one. This situation may lead to substantial variability in analysis outcomes. Thus, the present study sought to estimate the flexibility of neuroimaging analysis by submitting a single event-related fMRI experiment to a large number of unique analysis procedures. Ten analysis steps for which multiple strategies appear in the literature were identified, and two to four strategies were enumerated for each step. Considering all possible combinations of these strategies yielded 6,912 unique analysis pipelines. Activation maps from each pipeline were corrected for multiple comparisons using five thresholding approaches, yielding 34,560 significance maps. While some outcomes were relatively consistent across pipelines, others showed substantial methods-related variability in activation strength, location, and extent. Some analysis decisions contributed to this variability more than others, and different decisions were associated with distinct patterns of variability across the brain. Qualitative outcomes also varied with analysis parameters: many contrasts yielded significant activation under some pipelines but not others. Altogether, these results reveal considerable flexibility in the analysis of fMRI experiments. This observation, when combined with mathematical simulations linking analytic flexibility with elevated false positive rates, suggests that false positive results may be more prevalent than expected in the literature. This risk of inflated false positive rates may be mitigated by constraining the flexibility of analytic choices or by abstaining from selective analysis reporting.
Lecture for the course "CS 217 – Probability and Statistics for Computer …
Lecture for the course "CS 217 – Probability and Statistics for Computer Science" delivered at the City College of New York in Spring 2019 by Evan Agovino as part of the Tech-in-Residence Corps program.
No restrictions on your remixing, redistributing, or making derivative works. Give credit to the author, as required.
Your remixing, redistributing, or making derivatives works comes with some restrictions, including how it is shared.
Your redistributing comes with some restrictions. Do not remix or make derivative works.
Most restrictive license type. Prohibits most uses, sharing, and any changes.
Copyrighted materials, available under Fair Use and the TEACH Act for US-based educators, or other custom arrangements. Go to the resource provider to see their individual restrictions.