In this resource, students play a climate resilience game and then explore …
In this resource, students play a climate resilience game and then explore the Intergovernmental Panel on Climate Change's 5th Assessment Report to learn more about how climate scientists handle uncertainty in models.
In this activity, students make and manipulate physical shoreline models to discover …
In this activity, students make and manipulate physical shoreline models to discover the features of resilient shorelines and to critically evaluate the impacts of rising seas. Students will use NOAA's Sea Level Rise Viewer to observe a coastal area of interest and predict the consequences of sea level rise on people, the environment, and the economy. Though the curriculum references North Carolina, this lesson will work for all coastal areas.
Students create a model of sea level rise based on the melting …
Students create a model of sea level rise based on the melting of land ice, sea ice, or grounded ice. Student predictions are recorded and models are run. Making explanations based on data, cause and effect, and asking questions are emphasized in this activity.
This web mapping tool allows users to investigate impacts of sea level …
This web mapping tool allows users to investigate impacts of sea level rise. Data is included from across the United States at different scales. Various timelines and sea level rise projections can be explored.
This activity is a Google Slide playlist. Students will analyze data from …
This activity is a Google Slide playlist. Students will analyze data from sediments collected off the coast of Santa Barbara, California to determine whether this information can be used to study historical climate change. This playlist is suitable for use in remote, hybrid, or in-person instruction and can easily be added to a Learning Management System.
Provenance: Molly Ludwick, Kings Mountain Middle School Reuse: This item is offered under a Creative Commons Attribution-NonCommercial-ShareAlike license http://creativecommons.org/licenses/by-nc-sa/3.0/ You may reuse this item for non-commercial purposes as long as you provide attribution and offer any derivative works under a similar license.
(Note: this resource was added to OER Commons as part of a batch upload of over 2,200 records. If you notice an issue with the quality of the metadata, please let us know by using the 'report' button and we will flag it for consideration.)
This visualization is a series of three short animations/videos that illustrate how …
This visualization is a series of three short animations/videos that illustrate how the changing ice sheets result in sea level rise. It uses satellite data to show how Greenland and Antarctica are losing mass at a rate of 283 gigatons per year and 145 gigatons per year, respectively. Simulation shows visualization of one gigaton and how much this translates to sea level rise.
This video highlights a variety of climate change research initiatives from scientists …
This video highlights a variety of climate change research initiatives from scientists at the University of Colorado, Boulder. It describes the changing dynamics of Antarctic ice sheets and the impacts of reduced Arctic sea ice. The video illustrates the excitement of this research through interviews and video clips of scientists in the field.
This activity allows students to explore sea level rise. The experiment allows …
This activity allows students to explore sea level rise. The experiment allows them to test whether land ice and/or sea ice contribute to sea level rise as they melt.
This video follows Bermuda scientists into the field as they collect data …
This video follows Bermuda scientists into the field as they collect data that documents a warming trend in ocean temperatures. BIOS Director Tony Knapp discusses some of the impact of warming temperatures on sea levels, storms, and marine ecosystems.
This is a multi-step, interactive tool for users to identify potential risks …
This is a multi-step, interactive tool for users to identify potential risks (to people, buildings, infrastructure, contamination, land) for selected coastal areas in the US, using scenarios of water level rising (as a result of tides, sea level rise, and storm surge) from 0-10 feet. Tool provides local, regional and national resources as guidance for managing risk.
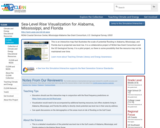
This is an interactive map that illustrates the scale of potential flooding …
This is an interactive map that illustrates the scale of potential flooding in Alabama, Mississippi, and Florida due to projected sea level rise. It is a collaborative project of NOAA Sea Grant Consortium and the US Geological Survey. It is a pilot project, so there is some possibility that the resource may not be maintained over time.
Through learning activities, students learn how weather over a long period of …
Through learning activities, students learn how weather over a long period of time describes climate, explore how sea level rise can affect coastal communities and environments, and describe how humans are contributing to climate change and how we can take action to solve this problem.
In this 60-minute interactive demonstration, students use ice blocks and heat lamps …
In this 60-minute interactive demonstration, students use ice blocks and heat lamps to model what will happen to coastlines around the world as glaciers melt. They explore why glaciers are melting as a consequence of global warming and how human activity has added to the amount of warming.
In this activity, students investigate how scientists monitor changes in Earth's glaciers, …
In this activity, students investigate how scientists monitor changes in Earth's glaciers, ice caps, and ice sheets. The activity is linked to 2009 PBS Nova program entitled Extreme Ice.
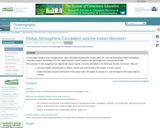
In this project students learn through lecture, video, and sketching about the …
In this project students learn through lecture, video, and sketching about the Coriolis effect, the "Six-Cell Generalized Global Atmospheric Circulation Model", the shifting ITCZ, the Indian Monsoon, and its impact on the day-to-day lives of the people of India. The outcomes for this assignment are aligned with course-specific outcomes articulated in the Minnesota Transfer Curriculum. They are:
Discuss/compare characteristics of diverse cultures and environments in the context of ocean science. Explain the basic structure and function of the ocean realm, the impact of humans on it, and the impact of the ocean realm on humans.
(Note: this resource was added to OER Commons as part of a batch upload of over 2,200 records. If you notice an issue with the quality of the metadata, please let us know by using the 'report' button and we will flag it for consideration.)
No restrictions on your remixing, redistributing, or making derivative works. Give credit to the author, as required.
Your remixing, redistributing, or making derivatives works comes with some restrictions, including how it is shared.
Your redistributing comes with some restrictions. Do not remix or make derivative works.
Most restrictive license type. Prohibits most uses, sharing, and any changes.
Copyrighted materials, available under Fair Use and the TEACH Act for US-based educators, or other custom arrangements. Go to the resource provider to see their individual restrictions.