Updating search results...

Search Resources

2822 Results

View
Selected filters:
Consider the Source: Research Skills for Cell Phone Libraries in a Digital Age
Read the Fine Print
Educational Use
Rating
0.0 stars

My curriculum unit, “Consider the Source: Research Skills for Cell Phone Libraries”, is a unit designed for a fifth-grade regular education English Language Arts class. A common core standard in ELA-writing is to complete a research writing piece that uses three references to support their findings. Many schools are not equipped to provide three sources for each student to use. Either the school library is not properly shelved or there is a lack of chrome books for every student in middle school to have access to on-line resources. It has provided a climate of uncertainty. One option would be to have students research their topics at home. Though their public library card may be invalid, most middle school students own a cell phone. The unit consists of skills to teach students how to use their cell phones for research purposes. By revamping traditional research tools, I hope it will provide a renewed love of investigative research and an enthusiasm to complete writing assignments.

Subject:
English Language Arts
Social Science
Material Type:
Lesson Plan
Unit of Study
Provider:
Yale-New Haven Teachers Institute
Provider Set:
2019 Curriculum Units Volume I
Date Added:
08/01/2019
Construct and Test Roofs for Different Climates
Read the Fine Print
Educational Use
Rating
0.0 stars

We design and create objects to make our lives easier and more comfortable. The houses in which we live are excellent examples of this. Depending on your local climate, the features of your house have been designed to satisfy your particular environmental needs: protection from hot, cold, windy and/or rainy weather. In this activity, students design and build model houses, then test them against various climate elements, and then re-design and improve them. Using books, websites and photos, students learn about the different types of roofs found on various houses in different environments throughout the world.

Subject:
Applied Science
Architecture and Design
Engineering
Material Type:
Activity/Lab
Provider:
TeachEngineering
Provider Set:
TeachEngineering
Author:
Abigail T. Waltrous
Denise W. Carlson
Martha Cyr
Date Added:
09/18/2014
Contemporary Climate Oscillations: ENSO and a case study of the Huanghe River
Conditional Remix & Share Permitted
CC BY-NC-SA
Rating
0.0 stars

This module uses data of monthly mean sea level pressure from Tahiti and Darwin, Australia to calculate the Southern Oscillation Index (SOI) of El Nino-Southern Oscillation (ENSO) for comparison with the Huanghe River (China) discharge and correlated anthropogenic effects.

Subject:
Applied Science
Environmental Science
Material Type:
Activity/Lab
Provider:
Science Education Resource Center (SERC) at Carleton College
Provider Set:
Teach the Earth
Author:
Steve Kuehl
Date Added:
01/20/2023
Contemporary World Problems, Environmental Science & English
Unrestricted Use
CC BY
Rating
0.0 stars

This theme-based English course integrates reading, writing, listening, speaking, and critical thinking skills around assignments and activities focusing on Environmental Science and Contemporary World Problems. Topics include population, ecology, climate change, pollution, food systems, environmental racism, and sustainability. Students will specifically focus on environmental issues related to the Pacific Northwest. Laboratories and field trips are included. This competency-based class allows students to work at their own pace, exit at a level appropriate to demonstrated skills and knowledge, and earn possible high school completion English, Lab Science, Contemporary World Problems and/or elective credits.

Subject:
Arts and Humanities
Career and Technical Education
Education
Life Science
Material Type:
Full Course
Date Added:
06/09/2017
Continental Climate and Oceanic Climate
Unrestricted Use
CC BY
Rating
0.0 stars

This activity proposes different small experiments and discussions to show that in the summer it is cooler by the sea than on the land and that water cools off more slowly than soil.

Subject:
Oceanography
Physical Geography
Physical Science
Material Type:
Activity/Lab
Provider:
International Astronomical Union
Provider Set:
astroEDU
Author:
Leiden Observatory
Date Added:
01/01/2016
Contour Mapping With Playdough
Conditional Remix & Share Permitted
CC BY-NC-SA
Rating
0.0 stars

Students measuring elevations in a model map area.

Provenance: Lynne Elkins, University of Nebraska at Lincoln
Reuse: This item is offered under a Creative Commons Attribution-NonCommercial-ShareAlike license http://creativecommons.org/licenses/by-nc-sa/3.0/ You may reuse this item for non-commercial purposes as long as you provide attribution and offer any derivative works under a similar license.
This exercise was designed in a department that has some basic support for developing inexpensive classroom equipment in cooperation with a machine shop. The shop built gridded mapping frames to my specifications using a simple aluminum design (a square frame of aluminum with small pins inserted at one-inch intervals). An even simpler DIY design could use thin but sturdy pieces of wood to create a wooden frame, with steel nails. My initial design called for 2'x2' frames, which turned out to be too large: mapping a 4 sq. ft. space at 1-inch resolution took more than a standard lab period for most students to complete. The attached exercise instructs students to use a smaller portion of the mapping grid; this can be revised for different size grids. Another issue to be aware of when designing mapping grid frames is whether to label the spaces with letters and numbers (as is done on many maps and was thus my original thinking) or to label the lines between the spaces, which is easier for data collection.


At the start of the lab, I typically give my students a few ground rules: they should avoid extremely flat areas, because the elevation rounding they are likely to do will make contouring them very difficult; their highest point should be at least 2 inches and not more than 4-5 inches high; they may not have vertical walls or overhangs (and should really keep the slopes less than 60-70Â at their steepest); the table surface is sea level with zero elevation; and most of their model area must be mappable land (not ocean, i.e. bare table). I give them large sheets of wax paper to construct the model on, for easy cleanup. I also provide large sheets of 1" grid paper so they can create a 1:1 map of their model (and I impose a scale calculation later for the model), and remind them several times not to invert the map labels when setting up their map grid. Typically this is all they need to know to begin creating and mapping a landscape. The mapping tools are pieces of string (to string across the pins on the mapping frames and position the grid points) and wooden skewers labeled with quarter-inch markings.


After an initial attempt to make the playdough for this lab, my department opted to purchase 6-lb. tubs of commercial playdough. It is ultimately relatively inexpensive because it is reusable almost indefinitely, as long as it is stored tightly sealed (we use zip-loc bags inside the commercial containers) and occasionally spritzed with water--once a year usually works fine for keeping it hydrated for storage over the rest of the year, but that may vary with climate and frequency of use. Typically I walk around while they are getting started and make commentary on their landscapes, and then when there are no further questions I go to the board and create an example data set and contour map. While a photocopied paper example map would accomplish the same thing, this approach lets me tailor my examples to what I see they are doing (e.g., including circular depressions, saddles, or ridges). I also have handy and frequently refer the students to USGS quads from around the country when they are mapping, e.g. a very flat quad with depressions in central Florida and a very steep quad from the Grand Canyon.


When they are mapping, I typically advise them to 1) sketch in the shoreline around their zero-elevation values by comparing to the model, 2) add major peaks between grid lines as needed, and 3) map from the highest parts of their map area downward. I also discourage contour intervals smaller than 1/2-inch, particularly when their model contains flat terrain. Many students want to be more precise, and if they have estimated depths to the nearest 1/8-inch it is possible to contour at 1/4-inch intervals, but typically their rounded measurements in flat areas make this quite tricky. It often is necessary for me (and/or TAs) to walk around and give them advice in places they are stuck and remind them how contours work.


Making the profile is usually very quick. The graph provided would need to be adjusted/replaced for different size mapping grids, but works well for a grid that runs from A to O on one side and from 1 to 10+ on the other.


If they are kept on task everyone except the most cautious or disorganized groups can typically finish elevation measurements for about 2 sq. ft. of map area within 1.5 hours. With an introductory spiel, that leaves about an hour for finishing most of the contouring and transferring data for the profile. Faster groups will probably finish all the final details but are well-advised to take the lab home to double check the details. Slower groups may finish coloring and looking at the local topo map on their own. Longer lab periods would permit a more detailed study of the local USGS maps and/or a larger model size--this was written for a 3-hour lab period.

(Note: this resource was added to OER Commons as part of a batch upload of over 2,200 records. If you notice an issue with the quality of the metadata, please let us know by using the 'report' button and we will flag it for consideration.)

Subject:
Biology
Life Science
Material Type:
Activity/Lab
Provider:
Science Education Resource Center (SERC) at Carleton College
Provider Set:
Teach the Earth
Author:
Lynne Elkins
Date Added:
03/03/2022
Contribution of the Cryosphere to Changes in Sea Level
Read the Fine Print
Educational Use
Rating
0.0 stars

This web page from the National Snow and Ice Data Center contains two related visualizations and supporting information about them. The first visualization gives an estimate of the percent contribution to sea level change since the 1990s from three contributors - small glaciers and ice caps, the Greenland Ice Sheet and the Antarctic Ice Sheet. The second visualization shows the cumulative contribution to sea level from small glaciers and ice caps plotted with the annual global surface air temperature anomaly.

Subject:
Applied Science
Career and Technical Education
Environmental Science
Environmental Studies
Oceanography
Physical Science
Material Type:
Reading
Provider:
CLEAN: Climate Literacy and Energy Awareness Network
Provider Set:
CLEAN: Climate Literacy and Energy Awareness Network
Author:
M.F. Meier
Mark Dyurgerov
National Snow and Ice Data Center
Date Added:
08/29/2012
Controversies in the Earth Sciences
Conditional Remix & Share Permitted
CC BY-NC-SA
Rating
0.0 stars

Think science has all the answers? Think again. This course will use real, authentic data to explore and investigate modern controversies in Earth Sciences. Use tide gauge records to understand how countries around the world attempt to protect themselves from tsunami events. Process seismic data to predict earthquake recurrence in the New Madrid seismic zone, right here in the breadbasket of the US. Sort through the millions of years of the geologic timeline to shed some light on what actually did, and did not, kill the dinosaurs. Finally, use global atmospheric data to understand how misrepresentation of data can be used to paint a distorted view of past, present, and future climate.

Subject:
Applied Science
Atmospheric Science
Environmental Science
Oceanography
Physical Science
Material Type:
Full Course
Provider:
Penn State College of Earth and Mineral Sciences
Author:
Eliza Richardson
Date Added:
10/07/2019
Convective Cloud Systems
Read the Fine Print
Educational Use
Rating
0.0 stars

This video segment adapted from the Atmospheric Radiation Program explains the differences in the formation of tropical convective cloud systems over islands and over the ocean.

Subject:
Atmospheric Science
Physical Science
Material Type:
Activity/Lab
Diagram/Illustration
Provider:
PBS LearningMedia
Provider Set:
PBS Learning Media: Multimedia Resources for the Classroom and Professional Development
Author:
National Science Foundation
WGBH Educational Foundation
Date Added:
12/17/2005
Conversations with History: Capitalism, the Environment, and Crossing from Crisis to Sustainability
Read the Fine Print
Rating
0.0 stars

Conversations host Harry Kreisler welcomes Yale Professor James Gustave Speth for a discussion of his career in the environmental movement. Professor Speth traces his changing perspective on the appropriate response to the environmental crisis. Concluding that only a radical transformation of capitalism will save the planet for future generations, he outlines the changes in consciousness and in the political agenda that will be required. (54 minutes)

Subject:
Arts and Humanities
Economics
Social Science
Material Type:
Lecture
Provider:
UCTV Teacher's Pet
Date Added:
06/23/2007
Cool Cores Capture Climate Change
Unrestricted Use
CC BY
Rating
0.0 stars

This Earth Exploration Toolbook chapter is a detailed computer-based exploration in which students learn how various climatic conditions impact the formations of sediment layers on the ocean floor. They analyze sediment core data from the Ross Ice Shelf in Antarctica for evidence of climate changes over time. In addition, they interact with various tools and animations throughout the activity, in particular the Paleontological Stratigraphic Interval Construction and Analysis Tool (PSICAT) that is used to construct a climate change model of a sediment core from core images.

Subject:
Archaeology
Career and Technical Education
Environmental Studies
Oceanography
Physical Geography
Physical Science
Social Science
Material Type:
Activity/Lab
Provider:
CLEAN: Climate Literacy and Energy Awareness Network
Provider Set:
CLEAN: Climate Literacy and Energy Awareness Network
Author:
Earth Exploration Toolbook/TERC
Jean Pennycook
Date Added:
06/19/2012
Cooling factors
Read the Fine Print
Rating
0.0 stars

This qualitative graphic illustrates the various factors that affect the amount of solar radiation hitting or being absorbed by Earth's surface such as aerosols, clouds, and albedo.

Subject:
Applied Science
Career and Technical Education
Environmental Science
Environmental Studies
Geoscience
History
History, Law, Politics
Physical Science
Provider:
CLEAN: Climate Literacy and Energy Awareness Network
Provider Set:
CLEAN: Climate Literacy and Energy Awareness Network
Author:
Philippe Rekacewicz
UNEP/GRID-Arendal
Date Added:
10/27/2014
Coping With Climate Anxiety
Conditional Remix & Share Permitted
CC BY-NC
Rating
0.0 stars

In this lesson, students learn about climate anxiety and create a climate anxiety toolkit.

Step 1 - Inquire: Students discuss statistics about the prevalence of climate anxiety in children and young people and try out a strategy to cope with this anxiety.

Step 2 - Investigate: Students research and practice a strategy to manage anxiety and create a one-page mini-poster about this strategy.

Step 3 - Inspire: Students share their mini-poster with the class, and students discuss what they learned from each other.

Subject:
Applied Science
Environmental Science
Health, Medicine and Nursing
Material Type:
Activity/Lab
Lesson
Lesson Plan
Provider:
SubjectToClimate
Author:
Effie Albitz
Subject to Climate
Date Added:
04/06/2023
Coping With Climate Anxiety
Conditional Remix & Share Permitted
CC BY-NC
Rating
0.0 stars

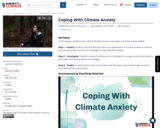
SYNOPSIS: In this lesson, students learn about climate anxiety and create a climate anxiety toolkit.

SCIENTIST NOTES: The lesson provides deep thoughts for students to understand and proffer strategies to overcome climate anxiety and chronic fear of environmental doom. This lesson is imperative as it will help students and young people to cope with emotional distress, inequities, depression, and marginalization they often face when engaging in climate action. It is also a source of inspiration to share their climate stories and to take opportunities to save the planet for the future. All materials, videos, and images are well-sourced, and this lesson is recommended for classroom use.

POSITIVES:
-Students are able to practice emotional regulation and identify specific coping strategies that work for them.
-Students have a choice in which strategy to research and can use creativity in creating their mini-poster.

ADDITIONAL PREREQUISITES:
-This lesson focuses on coping strategies; however, this is not an indication that coping with climate anxiety is a solution to the root causes of the climate crisis.
-There may be students who feel little or no climate anxiety. Teachers should remind students that these strategies help process many different emotions like sadness, anger, frustration, etc. Also, these strategies can be used to process feelings from any situation or cause such as academics, family, relationships, friendships, body image, etc.
-There may be students in the class who are suffering from more severe anxiety or depression. Teachers should look out for students who may be displaying concerning behavior and need outside support. Teachers should be prepared to direct students toward school or community resources and contact relevant parties about their concerns.
-Students should be familiar with finding credible sources and completing short research assignments.
-Students should already have an understanding of climate change and the risks to the future of the planet. If necessary, this video can be used as a primer.
-Students will need access to a computer.

DIFFERENTIATION:
-Teachers who have additional time to devote to this topic can show this twenty-minute video that deeply explores climate anxiety and navigating our complex emotional landscape. Teachers could show the video at the beginning of the lesson to introduce the concept of climate anxiety, or it could be used later in the lesson for a class discussion.
-Students can work with a partner or small group instead of individually in the Investigate section of the lesson.
-Students can make digital mini-posters on a Google Document or a single Google Slide, or they can make them by hand if the materials are available.
-If time and weather permit, teachers can take students outside for the end of the Investigate section to practice their strategies. This would allow more space for strategies like yoga and spending time in nature.
-Teachers can display student posters in a classroom or hallways as a physical reminder of their climate anxiety toolkit strategies.
-The lesson can be completed over two or three class periods instead of one. For two classes, students can end the first class with strategy research work time and begin the second class with additional work time as needed. For three classes, the Inquire, Investigate, and Inspire sections of the lesson can be completed on three separate days.

Subject:
Applied Science
Health, Medicine and Nursing
Material Type:
Lesson Plan
Provider:
SubjectToClimate
Author:
Effie Albitz
Date Added:
06/30/2023
Coping With Climate Change: Green Roofs of Chicago
Read the Fine Print
Rating
0.0 stars

A set of eight photographs compiled into a series of slides explain how urban areas are facing challenges in keeping both their infrastructure and their residents cool as global temperatures rise. Chicago is tackling that problem with a green design makeover. This report is part of PBS's Coping with Climate Change series and could challenge students to consider engineering designs to help their own cities be greener.

Subject:
Physical Science
Material Type:
Simulation
Provider:
CLEAN: Climate Literacy and Energy Awareness Network
Provider Set:
CLEAN: Climate Literacy and Energy Awareness Network
Author:
Public Broadcasting System (PBS) Newshour
Date Added:
09/24/2018
Coral Bleaching: A White Hot Problem
Read the Fine Print
Rating
0.0 stars

This teaching activity addresses environmental stresses on corals. Students assess coral bleaching using water temperature data from the NOAA National Data Buoy Center. Students learn about the habitat of corals, the stresses on coral populations, and the impact of increased sea surface temperatures on coral reefs. In a discussion section, the connection between coral bleaching and global warming is drawn.

Subject:
Applied Science
Biology
Career and Technical Education
Environmental Science
Environmental Studies
Life Science
Physical Science
Material Type:
Activity/Lab
Provider:
CLEAN: Climate Literacy and Energy Awareness Network
Provider Set:
CLEAN: Climate Literacy and Energy Awareness Network
Author:
Bridge Project - NOAA Sea Grant and National Marine Educators Association
Laura Rose
Lisa Ayers Lawrence
Date Added:
06/19/2012
Coral Kid
Read the Fine Print
Educational Use
Rating
0.0 stars

In this video segment, ZOOM guest Cassie takes us on a tour of the coral reef near her home in Key Largo, Florida, and points out some of its unique features.

Subject:
Oceanography
Physical Science
Material Type:
Activity/Lab
Diagram/Illustration
Provider:
PBS LearningMedia
Provider Set:
PBS Learning Media: Multimedia Resources for the Classroom and Professional Development
Author:
National Science Foundation
WGBH Educational Foundation
Date Added:
10/21/2005
Coral Reefs in Hot Water
Read the Fine Print
Rating
0.0 stars

In this activity, student teams identify the locations of coral reefs around the world, examine infrared satellite images of the Earth, and research the impacts that are threatening the survival of coral reefs. Each team creates a short oral presentation describing the coral reef they have researched. Students then plot on a composite map the locations where coral bleaching is occurring. Student worksheets, a teacher guide, and assessment rubric are included. This activity is part of Coastal Areas: Coral Reefs in Hot Water, part of the lesson series, The Potential Consequences of Climate Variability and Change.

Subject:
Atmospheric Science
Geoscience
Life Science
Oceanography
Physical Science
Material Type:
Lecture Notes
Provider:
NASA
Provider Set:
NASA Wavelength
Date Added:
11/05/2014
Coral Reefs in Hot Water
Unrestricted Use
CC BY
Rating
0.0 stars

Coral Reefs in Hot Water is a short video displaying computerized data collected on the number of reefs impacted by coral bleaching around the world.

Subject:
Applied Science
Biology
Career and Technical Education
Environmental Science
Environmental Studies
Life Science
Oceanography
Physical Science
Provider:
CLEAN: Climate Literacy and Energy Awareness Network
Provider Set:
CLEAN: Climate Literacy and Energy Awareness Network
Author:
NOAA (National Oceanic and Atmospheric Administration)
Date Added:
06/19/2012