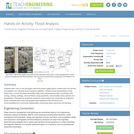
Students are introduced to the important concept of density with a focus …
Students are introduced to the important concept of density with a focus is on the more easily understood densities of solids. Students use different methods to determine the densities of solid objects, including water displacement to determine volumes of irregularly-shaped objects. By comparing densities of various solids to the density of water, and by considering the behavior of different solids when placed in water, students conclude that ordinarily, objects with densities greater than water sink, while those with densities less than water float. Then they explore the principle of buoyancy, and through further experimentation arrive at Archimedes' principle that a floating object displaces a mass of water equal to its own mass. Students may be surprised to discover that a floating object displaces more water than a sinking object of the same volume.
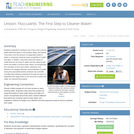
This lesson introduces students to the important concept of density. The focus …
This lesson introduces students to the important concept of density. The focus is on the more easily understood densities of solids, but students can also explore the densities of liquids and gases. Students devise methods to determine the densities of solid objects, including the method of water displacement to determine volumes of irregularly-shaped objects. By comparing densities of various solids to the density of water, and by considering the behavior of different solids when placed in water, students conclude that ordinarily, objects with densities greater than water will sink, while those with densities less than water will float. Density is an important material property for engineers to understand.
This informational text discusses the unique property of ice - that it …
This informational text discusses the unique property of ice - that it floats in liquid water. The text is written at a grade two through three This version is a full-color PDF that can be printed, cut and folded to form a book. Each book contains color photographs and illustrations.
This informational text discusses the unique property of ice - that it …
This informational text discusses the unique property of ice - that it floats in liquid water. Students focus on real-world examples and how ice is necessary for life in the polar regions. The text is written at a grade two through grade three reading level. This is a PDF containing the informational text and a glossary.
This informational text discusses the unique property of ice - that it …
This informational text discusses the unique property of ice - that it floats in liquid water. Students focus on real-world examples and how ice is necessary for life in the polar regions. The text is written at a kindergarten through grade one reading level. This version is a full-color PDF that can be printed, cut and folded to form a book. Each book contains color photographs and illustrations.
This informational text discusses the unique property of ice - that it …
This informational text discusses the unique property of ice - that it floats in liquid water. Students focus on real-world examples and how ice is necessary for life in the polar regions. The text is written at a kindergarten through grade one reading level. This is a PDF containing the informational text and a glossary.
In this lesson, students will test a variety of objects to determine …
In this lesson, students will test a variety of objects to determine if they float or sink in water. They will then create an object that neither floats nor sinks but "flinks."
Students experience firsthand one of the most common water treatment types in …
Students experience firsthand one of the most common water treatment types in the industry today, flocculants. They learn how the amount of suspended solids in water is measured using the basic properties of matter and light. In addition, they learn about the types of solids that can be found in water and the reasons that some are easier to remove than others. Encompassing the concepts of force and motion, attraction and repulsion of charged particles, and properties of matter, during the associated activity students see scientific concepts they already understand through the eyes of engineers who apply them to the removal of solids from water via chemical flocculants.
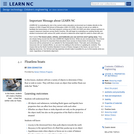
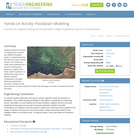
Students learn how to use and graph real-world stream gage data to …
Students learn how to use and graph real-world stream gage data to create event and annual hydrographs and calculate flood frequency statistics. Using an Excel spreadsheet of real-world event, annual and peak streamflow data, they manipulate the data (converting units, sorting, ranking, plotting), solve problems using equations, and calculate return periods and probabilities. Prompted by worksheet questions, they analyze the runoff data as engineers would. Students learn how hydrographs help engineers make decisions and recommendations to community stakeholders concerning water resources and flooding.
This Lecture Tutorial worksheet guides students through thinking about the effects humans …
This Lecture Tutorial worksheet guides students through thinking about the effects humans have on infiltration, and how that effects the duration and severity of floods. It is designed to be used in groups after a brief lecture introducing surface and ground water flow into a stream.
(Note: this resource was added to OER Commons as part of a batch upload of over 2,200 records. If you notice an issue with the quality of the metadata, please let us know by using the 'report' button and we will flag it for consideration.)
SSAC Geology of National Parks module/Geology of National Parks course. Students calculate …
SSAC Geology of National Parks module/Geology of National Parks course. Students calculate probabilities using USGS hydrograph data, a spreadsheet of daily stage heights, and the COUNTIF function.
SSAC Geology of National Parks module/Geology of National Parks course. Students calculate …
SSAC Geology of National Parks module/Geology of National Parks course. Students calculate probabilities using USGS hydrograph data, a spreadsheet of daily stage heights, and the COUNTIF function.
(Note: this resource was added to OER Commons as part of a batch upload of over 2,200 records. If you notice an issue with the quality of the metadata, please let us know by using the 'report' button and we will flag it for consideration.)
Mark C. Rains (University of South Florida), David C. Shelley (National Parks Service) and Len Vacher (University of South Florida)
Cover page by Len Vacher, University of South Florida
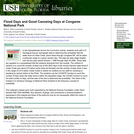
This assignment asks students to do a flood frequency analysis to determine …
This assignment asks students to do a flood frequency analysis to determine the size and stage of various floods and determine if the town of Crawford, OH is likely to be flooded or not. Outcomes: learn to work with quantitative data, learn to use Excel, be able to use USGS data.
(Note: this resource was added to OER Commons as part of a batch upload of over 2,200 records. If you notice an issue with the quality of the metadata, please let us know by using the 'report' button and we will flag it for consideration.)
This lab activity has students use stream discharge data obtained from the …
This lab activity has students use stream discharge data obtained from the USGS Water Resources Division web site in order to calculate recurrence intervals for a local stream. Using the recurrence data generated, the students then make recommendations to the residents of a local town as to what they might do to reduce their loss from the effects of frequent flooding in their community.
(Note: this resource was added to OER Commons as part of a batch upload of over 2,200 records. If you notice an issue with the quality of the metadata, please let us know by using the 'report' button and we will flag it for consideration.)
In this several week-long introductory geoscience project, students evaluate the potential for …
In this several week-long introductory geoscience project, students evaluate the potential for flooding in the local region. Students visit the site during the first week of the semester as part of a "Walk in the Watershed" and make observations in order to generate hypotheses about the processes that shape the landscape and control the movement of water. During a later lab period, students return to the same site to determine stream discharge using the flotation and current meter methods and compare and contrast the results from the two methods. In addition, students in the different laboratory sections use their data to compare and contrast reasons for why discharge may have changed over the course of the day or week during the following class meeting. As an in-class exercise, students examine an annual hydrograph and then predict the weather that generated the observed stream discharge. Students test their hypotheses by analyzing precipitation data available on-line in order to correlate flood events with storm types or other causes for major discharge events. Next, students examine historical flood and discharge data of the local stream available on-line at http://nwis.waterdata.usgs.gov/ as a homework assignment. In addition to calculating the recurrence interval and probability of occurrence for each event, students determine the discharge and stage of a 1-, 10-, 50-, and 100-year flood, create a rating curve, and generate a floodway map for each of these events. Subsequently, students revisit the site during lab and locate the boundaries of these flood events. Students will make recommendations for building a house in the region based on their analyses.
(Note: this resource was added to OER Commons as part of a batch upload of over 2,200 records. If you notice an issue with the quality of the metadata, please let us know by using the 'report' button and we will flag it for consideration.)
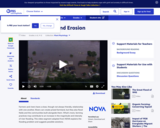
Students explore the impact of changing river volumes and different floodplain terrain …
Students explore the impact of changing river volumes and different floodplain terrain in experimental trials with table top-sized riverbed models. The models are made using modeling clay in aluminum baking pans placed on a slight incline. Water added "upstream" at different flow rates and to different riverbed configurations simulates different potential flood conditions. Students study flood dynamics as they modify the riverbed with blockages or levees to simulate real-world scenarios.
No restrictions on your remixing, redistributing, or making derivative works. Give credit to the author, as required.
Your remixing, redistributing, or making derivatives works comes with some restrictions, including how it is shared.
Your redistributing comes with some restrictions. Do not remix or make derivative works.
Most restrictive license type. Prohibits most uses, sharing, and any changes.
Copyrighted materials, available under Fair Use and the TEACH Act for US-based educators, or other custom arrangements. Go to the resource provider to see their individual restrictions.