In these activities designed to introduce sampling distributions and the Central Limit …
In these activities designed to introduce sampling distributions and the Central Limit Theorem, students generate several small samples and note patterns in the distributions of the means and proportions that they themselves calculate from these samples.
Short Description: Co-created with students in the course EDUC 395: Teaching Disciplinary …
Short Description: Co-created with students in the course EDUC 395: Teaching Disciplinary Literacy and supported by CDL experts, this textbook offers accessible, research-based, multidisciplinary CDL strategies ready for implementation in secondary classrooms.
Long Description: Co-created with students in the course EDUC 395: Teaching Disciplinary Literacy and supported by CDL experts, this textbook offers accessible, research-based, multidisciplinary CDL strategies ready for implementation in secondary classrooms.
Word Count: 9707
(Note: This resource's metadata has been created automatically by reformatting and/or combining the information that the author initially provided as part of a bulk import process.)
¿Cuál es el nivel de ruido existente Av. Av. 3 de Julio …
¿Cuál es el nivel de ruido existente Av. Av. 3 de Julio y sus intersecciones entre la calle Ambato y la Y del Indio Colorado de la ciudad de Santo Domingo?, el presente trabajo de investigación tiene como objetivo principal conocer el nivel de ruido existente en este sector de la ciudad, con el fin de determinar el alcance de su afectación y sobre todo sus fuentes, se realizó la evaluación correspondiente de acuerdo con la normativa TULSMA. y Decreto Ejecutivo N° 2393, aplicando la investigación de campo se midió la presencia de ruido ambiental y ocupacional, se requirió del uso de dosímetros calibrados y certificados para obtener información precisa. En esta investigación se estudió estas importantes intersecciones, siendo que, en cuanto a normativa ambiental sobrepasa el nivel tolerable con un diferencial de 10 decibeles en promedio, mientras que en referencia del ruido laboral esta intersección está por debajo de los niveles permisibles con al menos 9 decibeles en promedio, las posibles enfermedades subyacentes más comunes encontradas fueron el estrés, los dolores de cabeza que afectaban principalmente a la población comerciante permanente, y la actividad que mayor emisión de ruido produjo fue el tránsito vehicular, del mismo modo se identificó que el día que se produjo mayor contaminación acústica fue el sábado entre las 11:30 am hasta la 13:00 pm.
Understanding Biodiversity presents an overview of biodiversity, its importance and relevance to …
Understanding Biodiversity presents an overview of biodiversity, its importance and relevance to humans, all living things, and the Earth. It includes species pages and a template to engage and involve students in real-life data collection.
How are rising sea levels already influencing different regions? This unit offers …
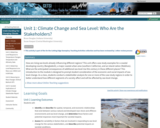
How are rising sea levels already influencing different regions? This unit offers case study examples for a coastal developing country (Bangladesh), a major coastal urban area (southern California), and an island nation (Maldives). What are the anticipated consequences of additional sea-level rise this century in these different places? This introduction to the module is designed to prompt student consideration of the economic and social impacts of sea-level change. As a class, students conduct a stakeholder analysis for one or more of the case study regions in order to better understand how different segments of a society affect and will be affected by sea-level change.
Show more about Online Teaching suggestions Hide Online-adaptable: This exercise could be converted to online whole-class discussions and a breakout group activity. At least the whole-class portion would probably need to be done synchronously.
(Note: this resource was added to OER Commons as part of a batch upload of over 2,200 records. If you notice an issue with the quality of the metadata, please let us know by using the 'report' button and we will flag it for consideration.)
This unit initiates a discussion about the importance of recognizing faults in …
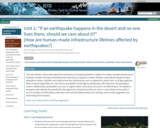
This unit initiates a discussion about the importance of recognizing faults in relation to modern societal infrastructure. Students consider the types of infrastructure necessary to support a modern lifestyle, especially for people living in population centers. Students also explore how key infrastructure such as aqueducts, power lines, or oil/gas pipelines, which traverse large distances, may also be susceptible to damage by earthquakes well away from the population centers. Additionally, earthquakes can occur in regions where none have occurred in recorded history. The ability to recognize and evaluate the potential for damage to key infrastructure that are near or cross a fault can be used, in turn, to classify and ultimately predict the most and least likely locations for damage, and to make suggestions for minimizing future impacts.
Show more about Online Teaching suggestions Hide Online-ready: The exercise is electronic and could be done individually or in small online groups (using the Google Earth rather than printable files). Lecture can be done in synchronous or asynchronous online format, although synchronous would allow better discussions of societal impacts of earthquakes.
(Note: this resource was added to OER Commons as part of a batch upload of over 2,200 records. If you notice an issue with the quality of the metadata, please let us know by using the 'report' button and we will flag it for consideration.)
This unit introduces the hydrological cycle to provide context for the module …
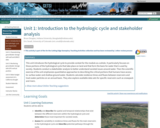
This unit introduces the hydrological cycle to provide context for the module as a whole. It particularly focuses on those portions of the hydrological cycle that take place on land and that form the basis for water that is used by society. Students conduct a stakeholder analysis to better understand societal issues around water. Then the scientific exercise of the unit emphasizes quantitative approaches to describing the critical portions that humans have access to: surface water and shallow ground water. Students calculate residence times and fluxes between reservoirs and track water particles on an annual basis. They also explore available data sets for specific reservoirs such as snowpack and rivers.
Show more about Online Teaching suggestions Hide Online-adaptable: This exercise could be converted to online whole-class discussions/lectures and a breakout group activity. Would be best done synchronously.
(Note: this resource was added to OER Commons as part of a batch upload of over 2,200 records. If you notice an issue with the quality of the metadata, please let us know by using the 'report' button and we will flag it for consideration.)
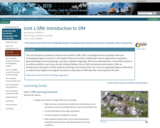
This unit introduces students to Structure from Motion (SfM). SfM is a …
This unit introduces students to Structure from Motion (SfM). SfM is a photogrammetric technique that uses overlapping images to construct a 3D model of the scene and has widespread research applications in geodesy, geomorphology, structural geology, and other subfields of geology. SfM can be collected from a hand-held camera or an airborne platform such as an aircraft, tethered balloon, kite, or UAS (unmanned aerial system). After an introduction to the basics of SfM, students will design and conduct their own survey of a geologic feature, followed by an optional (but highly encouraged) introductory exploration of SfM data after returning from the field.
Show more about Online Teaching suggestions Hide Online teaching: This unit was adapted to an online remote field teaching activity. Getting started with Structure from Motion (SfM) photogrammetry (remote field collection).
(Note: this resource was added to OER Commons as part of a batch upload of over 2,200 records. If you notice an issue with the quality of the metadata, please let us know by using the 'report' button and we will flag it for consideration.)
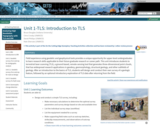
Field experience using geodetic and geophysical tools provides a unique opportunity for …
Field experience using geodetic and geophysical tools provides a unique opportunity for upper-level undergraduates to learn research skills applicable to their future graduate research or career path. This unit introduces students to terrestrial laser scanning (TLS), a ground-based, remote-sensing tool that generates three-dimensional point clouds, that has widespread research applications in geodesy, geomorphology, structural geology, and other subfields of geology. After an introduction to the basics of TLS, students will design and conduct their own survey of a geologic feature, followed by an optional introductory exploration of TLS data after returning from the field.
(Note: this resource was added to OER Commons as part of a batch upload of over 2,200 records. If you notice an issue with the quality of the metadata, please let us know by using the 'report' button and we will flag it for consideration.)
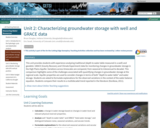
This unit provides students with experience analyzing traditional (depth to water table …
This unit provides students with experience analyzing traditional (depth to water table measured in a well) and geodetic: GRACE (Gravity Recovery and Climate Experiment) data for monitoring changes in groundwater storage in the High Plains Aquifer. Variations across timescales are compared, from seasonal to interannual to decadal. This comparison highlights some of the challenges associated with quantifying changes in groundwater storage at the regional scale. Aquifer properties are used to consider changes in terms of both "depth to water table" and water storage. Students are asked to formulate explanations for the observed variations in the context of the water balance equation. Students compare their results to a multidecadal trend reported in the literature (Konikow, 2011).
Show more about Online Teaching suggestions Hide Online-ready: The exercise is electronic and could be done individually or in small online groups. Lecture is best done synchronously due to the technical nature. Discussion would be better that way too.
(Note: this resource was added to OER Commons as part of a batch upload of over 2,200 records. If you notice an issue with the quality of the metadata, please let us know by using the 'report' button and we will flag it for consideration.)
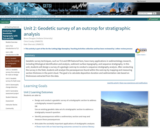
Geodetic survey techniques, such as TLS and SfM featured here, have many …
Geodetic survey techniques, such as TLS and SfM featured here, have many applications in sedimentology research, including lithological identification and analysis, sediment surface topography, and sequence stratigraphy. In this unit, students will design a survey of a geologic outcrop to conduct a sequence stratigraphy analysis. After conducting the survey in the field, students will analyze the parasequences found within the outcrop by mapping and measuring section thickness in the point cloud. The goal is to calculate deposition duration and sedimentation rate based on thicknesses extracted from the data.
(Note: this resource was added to OER Commons as part of a batch upload of over 2,200 records. If you notice an issue with the quality of the metadata, please let us know by using the 'report' button and we will flag it for consideration.)
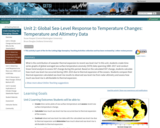
What is the contribution of seawater thermal expansion to recent sea-level rise? …
What is the contribution of seawater thermal expansion to recent sea-level rise? In this unit, students create time-series graphs of global averaged sea surface temperature anomaly (SSTA) data spanning 1880 -- 2017 and conduct linear trend analysis to assess SST change during this period. Based on the calculated SST change, students calculate how much sea-level rise occurred during 1993 -- 2015 due to thermal expansion of the oceans. Students compare their thermal expansion calculated sea-level rise results to observed sea-level rise from radar altimetry and assess how much sea-level rise is attributable to thermal expansion.
Show more about Online Teaching suggestions Hide Online-ready: The exercise is electronic and could be done individually or in small online groups. Lecture is best done synchronously due to the technical nature. Discussion would be better that way too.
(Note: this resource was added to OER Commons as part of a batch upload of over 2,200 records. If you notice an issue with the quality of the metadata, please let us know by using the 'report' button and we will flag it for consideration.)
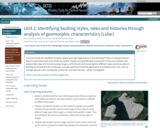
Can active faults be identified remotely, based upon their appearance in the …
Can active faults be identified remotely, based upon their appearance in the landscape? How can the geomorphic features associated with active faults be used to classify and quantify fault movement? In this unit, students will analyze lidar data and remote sensing imagery, with the aim of discovering how different styles and timescales of faulting are recorded in the landscape. Concepts pertinent to earthquake hazard and infrastructure risk -- such as average slip per event, earthquake recurrence, and fault slip rate -- will be investigated.
Show more about Online Teaching suggestions Hide Online-ready: The exercise is electronic and could be done individually or in small online groups (using the Google Earth rather than printable files). Lecture can be done in synchronous or asynchronous online format.
(Note: this resource was added to OER Commons as part of a batch upload of over 2,200 records. If you notice an issue with the quality of the metadata, please let us know by using the 'report' button and we will flag it for consideration.)
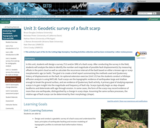
In this unit, students will design a survey (TLS and/or SfM) of …
In this unit, students will design a survey (TLS and/or SfM) of a fault scarp. After conducting the survey in the field, students will analyze the data to identify the number and magnitude of possible fault displacement(s) by measuring offsets in the point cloud as well as calculate the recurrence interval of the fault based on either a known age or scarp morphometric age (or both). The goal is to create a brief report summarizing the methods used and Quaternary history of displacements on the fault. An optional extension exercise (Unit 3.5) has the students conduct a hillslope diffusion analysis is using MATLAB. Fault scarps are the topographic evidence of earthquakes large and shallow enough to break the ground surface, and are evidence of Quaternary fault activity. A primary goal of studying exposed scarps is to gain insight into the magnitude and frequency of fault slip. Scarps typically begin as step-shaped landforms and deteriorate with age through erosion. In some cases, the form of the scarp may record evidence of more than one earthquake, distinguished by a change in scarp slope. Assuming the same surface processes, the relative age of fault scarps can be determined by their morphology (shape).
(Note: this resource was added to OER Commons as part of a batch upload of over 2,200 records. If you notice an issue with the quality of the metadata, please let us know by using the 'report' button and we will flag it for consideration.)
Bruce Douglas (Indiana University)
Nicholas Pinter (University of California Davis)
Nathan Niemi (University of Michigan)
J. Ramon Arrowsmith (Arizona State University)
Kate Shervais (UNAVCO)
Chris Crosby (UNAVCO)
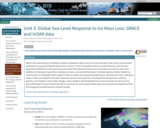
What is the contribution of melting ice sheets compared to other sources …
What is the contribution of melting ice sheets compared to other sources of sea-level rise? How much is the sea level projected to increase during the twenty-first century? In this unit students will use Gravity Recovery and Climate Experiment (GRACE) ice-mass loss time series from Greenland and Antarctica to calculate sea-level rise due to the addition of freshwater inputs from melting ice sheets, and use Interferometric Synthetic Aperture Radar (InSAR) ice-velocity data to extrapolate which regions of the ice sheets are losing the greatest mass. Sea-level rise from melting ice sheets is then contrasted to the other dominant causes of sea-level rise, including thermal expansion, melting glaciers, and changes in land water storage. Lastly, students will extrapolate how much sea-level rise will occur by year 2100 based on recent observed rates of sea-level rise and compare these values to sea-level rise projections from the Intergovernmental Panel on Climate Change.
Show more about Online Teaching suggestions Hide Online-ready: The exercise is electronic and could be done individually or in small online groups. Lecture is best done synchronously due to the technical nature. Discussion would be better that way too.
(Note: this resource was added to OER Commons as part of a batch upload of over 2,200 records. If you notice an issue with the quality of the metadata, please let us know by using the 'report' button and we will flag it for consideration.)
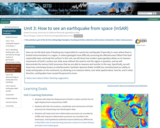
How can we tell what style of faulting was responsible for a …
How can we tell what style of faulting was responsible for a particular earthquake? Especially in cases where there is limited instrumentation in a region, or where geologists have difficulty accessing the affected areas? What if the fault responsible does not break the surface? In this unit, we will show how modern space geodesy allows us to measure movements of Earth's surface over wide areas without the need to visit the region in question, and we will demonstrate the various Earth processes that we are able to measure and monitor in this way. Specifically, we will show how a technique known as Interferometric Synthetic Aperture Radar (InSAR) has revolutionized our ability to study earthquakes on the continents, by allowing us to measure where, over what spatial extent, how far, and in what direction, earthquakes have caused the ground to move.
Show more about Online Teaching suggestions Hide Online-ready: The exercise is electronic and could be done individually or in small online groups. Lecture can be done in an online format. A synchronous session is recommended.
(Note: this resource was added to OER Commons as part of a batch upload of over 2,200 records. If you notice an issue with the quality of the metadata, please let us know by using the 'report' button and we will flag it for consideration.)
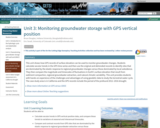
This unit shows how GPS records of surface elevation can be used …
This unit shows how GPS records of surface elevation can be used to monitor groundwater changes. Students calculate secular trends in the GPS time series and then use the original and detrended records to identify sites that are dominated by the elastic response to regional groundwater changes versus those dominated by local subsidence. They then compare the magnitude and timescales of fluctuations in Earth's surface elevation that result from sediment compaction, regional groundwater extraction, and natural climatic variability. This unit provides students with hands-on experience of the challenges and advantages of using geodetic data to study the terrestrial water cycle. The case study area is in California and the GPS records include the period of the profound 2012 -- 2016 drought.
Show more information on GPS versus GNSS Hide Note: Although the term GPS (Global Positioning System) is more commonly used in everyday language, it officially refers only to the USA's constellation of satellites. GNSS (Global Navigation Satellite System) is a universal term that refers to all satellite navigation systems including those from the USA (GPS), Russia (GLONASS), European Union (Galileo), China (BeiDou), and others. In this module, we use the term GPS even though, technically, some of the data may be coming from satellites in other systems.
Show more about Online Teaching suggestions Hide Online-ready: The exercise is electronic and could be done individually or in small online groups. Lecture is best done synchronously due to the technical nature. Discussion would be better that way too.
(Note: this resource was added to OER Commons as part of a batch upload of over 2,200 records. If you notice an issue with the quality of the metadata, please let us know by using the 'report' button and we will flag it for consideration.)
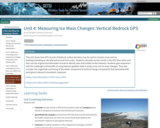
This unit shows how GPS records of bedrock surface elevation may be …
This unit shows how GPS records of bedrock surface elevation may be used to monitor snow and ice loading/unloading on decadal and annual time scales. Students calculate secular trends in the GPS time series and then use the original and detrended records to identify sites that exhibit similar behavior. Students gain experience with the challenges and benefits of using bedrock geodetic data to study snow and ice mass changes. They also consider the magnitude and timing of the elastic component of vertical change compared to that associated with post-glacial rebound (viscoelastic response).
Show more information on GPS versus GNSS Hide Note: Although the term GPS (Global Positioning System) is more commonly used in everyday language, it officially refers only to the USA's constellation of satellites. GNSS (Global Navigation Satellite System) is a universal term that refers to all satellite navigation systems including those from the USA (GPS), Russia (GLONASS), European Union (Galileo), China (BeiDou), and others. In this module, we use the term GPS even though, technically, some of the data may be coming from satellites in other systems.
Show more about Online Teaching suggestions Hide Online-ready: The exercise is electronic and could be done individually or in small online groups. Lecture is best done synchronously due to the technical nature. Discussion would be better that way too.
(Note: this resource was added to OER Commons as part of a batch upload of over 2,200 records. If you notice an issue with the quality of the metadata, please let us know by using the 'report' button and we will flag it for consideration.)
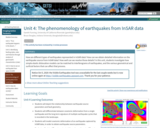
How are different types of earthquakes represented in InSAR data? How can …
How are different types of earthquakes represented in InSAR data? How can we obtain detailed information on the earthquake source from InSAR data? How well can we resolve those details? In this unit, students investigate how simple elastic dislocation models can be matched to interferograms of earthquakes, and the various geometrical and surficial factors that can affect that process.
Notice Oct 5, 2020: the Visible Earthquakes tool was unavailable for the last couple weeks but is now online again at https://visible-earthquakes.appspot.com. Thank you for your patience.
Show more about Online Teaching suggestions Hide Online-ready: The exercise is electronic and could be done individually or in small online groups. Lecture can be done in an online format. A synchronous session is recommended.
(Note: this resource was added to OER Commons as part of a batch upload of over 2,200 records. If you notice an issue with the quality of the metadata, please let us know by using the 'report' button and we will flag it for consideration.)
The California Drought of 2012 -- 2016 had significant social and economic …
The California Drought of 2012 -- 2016 had significant social and economic consequences. This final unit focuses on this drought as a case study for measuring the hydrologic system so that we can better understand fluxes, variability, uncertainties, and methods to measure them. Students analyze a variety of data that are relevant to basin-scale water budget: precipitation, terrestrial water storage, and snow pack. Traditional monitoring systems used are precipitation and snow pillow sensors. The newer geodetic methods are GRACE (Gravity Recovery and Climate Experiment satellite) and Reflection GPS. The students then use these data to consider water storage changes during the drought and how these changes compare in magnitude to human consumption. The work can start during a lab period and carry over into work outside of the lab time. The student exercise takes the form of responses to questions and tasks that tests a student's abilities to synthesize information and identify challenges in monitoring the terrestrial water cycle. Students then take the step-by-step exercise results and synthesize it into a report for California water policy makers to highlight the findings and pro/cons/uncertainties for the different methods. Unit 4 is the summative assessment for the module.
Show more information on GPS versus GNSS Hide Note: Although the term GPS (Global Positioning System) is more commonly used in everyday language, it officially refers only to the USA's constellation of satellites. GNSS (Global Navigation Satellite System) is a universal term that refers to all satellite navigation systems including those from the USA (GPS), Russia (GLONASS), European Union (Galileo), China (BeiDou), and others. In this module, we use the term GPS even though, technically, some of the data may be coming from satellites in other systems.
Show more about Online Teaching suggestions Hide Online-ready: The exercise is electronic and could be done individually or in small online groups. Lecture is best done synchronously due to the technical nature.
(Note: this resource was added to OER Commons as part of a batch upload of over 2,200 records. If you notice an issue with the quality of the metadata, please let us know by using the 'report' button and we will flag it for consideration.)
No restrictions on your remixing, redistributing, or making derivative works. Give credit to the author, as required.
Your remixing, redistributing, or making derivatives works comes with some restrictions, including how it is shared.
Your redistributing comes with some restrictions. Do not remix or make derivative works.
Most restrictive license type. Prohibits most uses, sharing, and any changes.
Copyrighted materials, available under Fair Use and the TEACH Act for US-based educators, or other custom arrangements. Go to the resource provider to see their individual restrictions.