Updating search results...

Search Resources

127 Results

View
Selected filters:
  • researchers
Preregistration: Improve Research Rigor, Reduce Bias
Unrestricted Use
CC BY
Rating
0.0 stars

In this webinar Professor Brian Nosek, Executive Director of the Center for Open Science (https://cos.io), outlines the practice of Preregistration and how it can aid in increasing the rigor and reproducibility of research. The webinar is co-hosted by the Health Research Alliance, a collaborative member organization of nonprofit research funders. Slides available at: https://osf.io/9m6tx/

Subject:
Applied Science
Computer Science
Information Science
Material Type:
Lecture
Provider:
Center for Open Science
Author:
Center for Open Science
Date Added:
08/07/2020
Preregistration Overview page
Unrestricted Use
CC BY
Rating
0.0 stars

What is Preregistration? When you preregister your research, you're simply specifying your research plan in advance of your study and submitting it to a registry. Preregistration separates hypothesis-generating (exploratory) from hypothesis-testing (confirmatory) research. Both are important. But the same data cannot be used to generate and test a hypothesis, which can happen unintentionally and reduce the credibility of your results. Addressing this problem through planning improves the quality and transparency of your research. This helps you clearly report your study and helps others who may wish to build on it.

Subject:
Applied Science
Life Science
Physical Science
Social Science
Material Type:
Reading
Provider:
Center for Open Science
Author:
Center for Open Science
Date Added:
06/18/2020
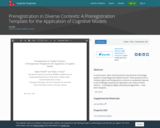
Preregistration in Complex Contexts: A Preregistration Template for the Application of Cognitive Models
Unrestricted Use
CC BY
Rating
0.0 stars

In recent years, open science practices have become increasingly popular in psychology and related sciences. These practices aim to increase rigour and transparency in science as a potential response to the challenges posed by the replication crisis. Many of these reforms -- including the highly influential preregistration -- have been designed for experimental work that tests simple hypotheses with standard statistical analyses, such as assessing whether an experimental manipulation has an effect on a variable of interest. However, psychology is a diverse field of research, and the somewhat narrow focus of the prevalent discussions surrounding and templates for preregistration has led to debates on how appropriate these reforms are for areas of research with more diverse hypotheses and more complex methods of analysis, such as cognitive modelling research within mathematical psychology. Our article attempts to bridge the gap between open science and mathematical psychology, focusing on the type of cognitive modelling that Crüwell, Stefan, & Evans (2019) labelled model application, where researchers apply a cognitive model as a measurement tool to test hypotheses about parameters of the cognitive model. Specifically, we (1) discuss several potential researcher degrees of freedom within model application, (2) provide the first preregistration template for model application, and (3) provide an example of a preregistered model application using our preregistration template. More broadly, we hope that our discussions and proposals constructively advance the debate surrounding preregistration in cognitive modelling, and provide a guide for how preregistration templates may be developed in other diverse or complex research contexts.

Subject:
Applied Science
Life Science
Physical Science
Social Science
Material Type:
Reading
Author:
Nathan Evans
Sophia Crüwell
Date Added:
12/07/2019
Programming with MATLAB
Unrestricted Use
CC BY
Rating
0.0 stars

The best way to learn how to program is to do something useful, so this introduction to MATLAB is built around a common scientific task: data analysis. Our real goal isn’t to teach you MATLAB, but to teach you the basic concepts that all programming depends on. We use MATLAB in our lessons because: we have to use something for examples; it’s well-documented; it has a large (and growing) user base among scientists in academia and industry; and it has a large library of packages available for performing diverse tasks. But the two most important things are to use whatever language your colleagues are using, so that you can share your work with them easily, and to use that language well.

Subject:
Applied Science
Computer Science
Information Science
Mathematics
Measurement and Data
Material Type:
Module
Provider:
The Carpentries
Author:
Gerard Capes
Date Added:
03/20/2017
Programming with Python
Unrestricted Use
CC BY
Rating
0.0 stars

The best way to learn how to program is to do something useful, so this introduction to Python is built around a common scientific task: data analysis. Arthritis Inflammation We are studying inflammation in patients who have been given a new treatment for arthritis, and need to analyze the first dozen data sets of their daily inflammation. The data sets are stored in comma-separated values (CSV) format: each row holds information for a single patient, columns represent successive days. The first three rows of our first file look like this: 0,0,1,3,1,2,4,7,8,3,3,3,10,5,7,4,7,7,12,18,6,13,11,11,7,7,4,6,8,8,4,4,5,7,3,4,2,3,0,0 0,1,2,1,2,1,3,2,2,6,10,11,5,9,4,4,7,16,8,6,18,4,12,5,12,7,11,5,11,3,3,5,4,4,5,5,1,1,0,1 0,1,1,3,3,2,6,2,5,9,5,7,4,5,4,15,5,11,9,10,19,14,12,17,7,12,11,7,4,2,10,5,4,2,2,3,2,2,1,1 Each number represents the number of inflammation bouts that a particular patient experienced on a given day. For example, value “6” at row 3 column 7 of the data set above means that the third patient was experiencing inflammation six times on the seventh day of the clinical study. So, we want to: Calculate the average inflammation per day across all patients. Plot the result to discuss and share with colleagues. To do all that, we’ll have to learn a little bit about programming.

Subject:
Applied Science
Computer Science
Information Science
Mathematics
Measurement and Data
Material Type:
Module
Provider:
The Carpentries
Author:
Anne Fouilloux
Lauren Ko
Maxim Belkin
Trevor Bekolay
Valentina Staneva
Date Added:
08/07/2020
Programming with R
Unrestricted Use
CC BY
Rating
0.0 stars

The best way to learn how to program is to do something useful, so this introduction to R is built around a common scientific task: data analysis. Our real goal isn’t to teach you R, but to teach you the basic concepts that all programming depends on. We use R in our lessons because: we have to use something for examples; it’s free, well-documented, and runs almost everywhere; it has a large (and growing) user base among scientists; and it has a large library of external packages available for performing diverse tasks. But the two most important things are to use whatever language your colleagues are using, so you can share your work with them easily, and to use that language well. We are studying inflammation in patients who have been given a new treatment for arthritis, and need to analyze the first dozen data sets of their daily inflammation. The data sets are stored in CSV format (comma-separated values): each row holds information for a single patient, and the columns represent successive days. The first few rows of our first file look like this: 0,0,1,3,1,2,4,7,8,3,3,3,10,5,7,4,7,7,12,18,6,13,11,11,7,7,4,6,8,8,4,4,5,7,3,4,2,3,0,0 0,1,2,1,2,1,3,2,2,6,10,11,5,9,4,4,7,16,8,6,18,4,12,5,12,7,11,5,11,3,3,5,4,4,5,5,1,1,0,1 0,1,1,3,3,2,6,2,5,9,5,7,4,5,4,15,5,11,9,10,19,14,12,17,7,12,11,7,4,2,10,5,4,2,2,3,2,2,1,1 0,0,2,0,4,2,2,1,6,7,10,7,9,13,8,8,15,10,10,7,17,4,4,7,6,15,6,4,9,11,3,5,6,3,3,4,2,3,2,1 0,1,1,3,3,1,3,5,2,4,4,7,6,5,3,10,8,10,6,17,9,14,9,7,13,9,12,6,7,7,9,6,3,2,2,4,2,0,1,1 We want to: load that data into memory, calculate the average inflammation per day across all patients, and plot the result. To do all that, we’ll have to learn a little bit about programming.

Subject:
Applied Science
Computer Science
Information Science
Mathematics
Measurement and Data
Material Type:
Module
Provider:
The Carpentries
Author:
Diya Das
Katrin Leinweber
Rohit Goswami
Date Added:
03/20/2017
Project Organization and Management for Genomics
Unrestricted Use
CC BY
Rating
0.0 stars

Data Carpentry Genomics workshop lesson to learn how to structure your metadata, organize and document your genomics data and bioinformatics workflow, and access data on the NCBI sequence read archive (SRA) database. Good data organization is the foundation of any research project. It not only sets you up well for an analysis, but it also makes it easier to come back to the project later and share with collaborators, including your most important collaborator - future you. Organizing a project that includes sequencing involves many components. There’s the experimental setup and conditions metadata, measurements of experimental parameters, sequencing preparation and sample information, the sequences themselves and the files and workflow of any bioinformatics analysis. So much of the information of a sequencing project is digital, and we need to keep track of our digital records in the same way we have a lab notebook and sample freezer. In this lesson, we’ll go through the project organization and documentation that will make an efficient bioinformatics workflow possible. Not only will this make you a more effective bioinformatics researcher, it also prepares your data and project for publication, as grant agencies and publishers increasingly require this information. In this lesson, we’ll be using data from a study of experimental evolution using E. coli. More information about this dataset is available here. In this study there are several types of files: Spreadsheet data from the experiment that tracks the strains and their phenotype over time Spreadsheet data with information on the samples that were sequenced - the names of the samples, how they were prepared and the sequencing conditions The sequence data Throughout the analysis, we’ll also generate files from the steps in the bioinformatics pipeline and documentation on the tools and parameters that we used. In this lesson you will learn: How to structure your metadata, tabular data and information about the experiment. The metadata is the information about the experiment and the samples you’re sequencing. How to prepare for, understand, organize and store the sequencing data that comes back from the sequencing center How to access and download publicly available data that may need to be used in your bioinformatics analysis The concepts of organizing the files and documenting the workflow of your bioinformatics analysis

Subject:
Business and Communication
Genetics
Life Science
Management
Material Type:
Module
Provider:
The Carpentries
Author:
Amanda Charbonneau
Bérénice Batut
Daniel O. S. Ouso
Deborah Paul
Erin Alison Becker
François Michonneau
Jason Williams
Juan A. Ugalde
Kevin Weitemier
Laura Williams
Paula Andrea Martinez
Peter R. Hoyt
Rayna Michelle Harris
Taylor Reiter
Toby Hodges
Tracy Teal
Date Added:
08/07/2020
Project Teaching Integrity in Empirical Research (TIER)
Conditional Remix & Share Permitted
CC BY-NC
Rating
0.0 stars

The Project Teaching Integrity in Empirical Research (TIER) develops methods and tools for enhancing research transparency through teaching. These can be used by faculty who teach quantitative methods or supervise student research. TIER further provides guidance to students who want to adopt transparent and replicable research practices independently.

Subject:
Applied Science
Life Science
Physical Science
Social Science
Material Type:
Teaching/Learning Strategy
Provider:
Project TIER
Date Added:
11/07/2014
Python for Harvesting Data on the Web
Conditional Remix & Share Permitted
CC BY-NC
Rating
0.0 stars

This session is an intermediate-to-advanced level class that offers some ideas for how to approach the following common data wrangling needs in research: 1) Obtain data and load it into a suitable data "container" for analysis, often via a web interface, especially an API, 2) parse the data retrieved via an API and turn it into a useful object for manipulation and analysis, and 3) perform some basic summary counts of records in a dataset and work up a quick visualization.

Subject:
Applied Science
Life Science
Physical Science
Social Science
Material Type:
Activity/Lab
Provider:
New York University
Author:
Nick Wolf
Vicky Steeves
Date Added:
01/06/2020
Python for Humanities
Unrestricted Use
CC BY
Rating
0.0 stars

Python is a general purpose programming language that is useful for writing scripts to work effectively and reproducibly with data. This is an introduction to Python designed for participants with no programming experience. These lessons can be taught in a day (~ 6 hours). They start with some basic information about Python syntax, the Jupyter notebook interface, and move through how to import CSV files, using the pandas package to work with data frames, how to calculate summary information from a data frame, and a brief introduction to plotting. The last lesson demonstrates how to work with databases directly from Python.

Subject:
Applied Science
Computer Science
Information Science
Mathematics
Measurement and Data
Material Type:
Module
Provider:
The Carpentries
Author:
Iain Emsley
Date Added:
08/07/2020
Qualitative Research Using Open Tools
Unrestricted Use
CC BY
Rating
0.0 stars

Qualitative research has long suffered from a lack of free tools for analysis, leaving no options for researchers without significant funds for software licenses. This presents significant challenges for equity. This panel discussion will explore the first two free/libre open source qualitative analysis tools out there: qcoder (R package) and Taguette (desktop application). Drawing from the diverse backgrounds of the presenters (social science, library & information science, software engineering), we will discuss what openness and extensibility means for qualitative research, and how the two tools we've built facilitate equitable, open sharing.

Subject:
Applied Science
Life Science
Physical Science
Social Science
Material Type:
Lesson
Provider:
New York University
Author:
Beth M. Duckles
Vicky Steeves
Date Added:
05/07/2019
RStudio Cheatsheets
Unrestricted Use
CC BY
Rating
0.0 stars

RStudio Cheatsheets

The cheatsheets below make it easy to use some of our favorite packages. Cheatsheets include the following topics:

Python with R and Reticulate Cheatsheet
The reticulate package provides a comprehensive set of tools for interoperability between Python and R. With reticulate, you can call Python from R in a variety of ways including importing Python modules into R scripts, writing R Markdown Python chunks, sourcing Python scripts, and using Python interactively within the RStudio IDE. This cheatsheet will remind you how.

Factors with forcats Cheatsheet
Factors are R’s data structure for categorical data. The forcats package makes it easy to work with factors. This cheatsheet reminds you how to make factors, reorder their levels, recode their values, and more.

Tidy Evaluation with rlang Cheatsheet
Tidy Evaluation (Tidy Eval) is a framework for doing non-standard evaluation in R that makes it easier to program with tidyverse functions. Non-standard evaluation, better thought of as “delayed evaluation,” lets you capture a user’s R code to run later in a new environment or against a new data frame. The tidy evaluation framework is implemented by the rlang package and used by functions throughout the tidyverse.

Deep Learning with Keras Cheatsheet
Keras is a high-level neural networks API developed with a focus on enabling fast experimentation. Keras supports both convolution based networks and recurrent networks (as well as combinations of the two), runs seamlessly on both CPU and GPU devices, and is capable of running on top of multiple back-ends including TensorFlow, CNTK, and Theano.

Dates and Times Cheatsheet
Lubridate makes it easier to work with dates and times in R. This lubridate cheatsheet covers how to round dates, work with time zones, extract elements of a date or time, parse dates into R and more. The back of the cheatsheet describes lubridate’s three timespan classes: periods, durations, and intervals; and explains how to do math with date-times.

Work with Strings Cheatsheet
The stringr package provides an easy to use toolkit for working with strings, i.e. character data, in R. This cheatsheet guides you through stringr’s functions for manipulating strings. The back page provides a concise reference to regular expresssions, a mini-language for describing, finding, and matching patterns in strings.

Apply Functions Cheatsheet
The purrr package makes it easy to work with lists and functions. This cheatsheet will remind you how to manipulate lists with purrr as well as how to apply functions iteratively to each element of a list or vector. The back of the cheatsheet explains how to work with list-columns. With list columns, you can use a simple data frame to organize any collection of objects in R.

Data Import Cheatsheet
The Data Import cheatsheet reminds you how to read in flat files with http://readr.tidyverse.org/, work with the results as tibbles, and reshape messy data with tidyr. Use tidyr to reshape your tables into tidy data, the data format that works the most seamlessly with R and the tidyverse.

Data Transformation Cheatsheet
dplyr provides a grammar for manipulating tables in R. This cheatsheet will guide you through the grammar, reminding you how to select, filter, arrange, mutate, summarise, group, and join data frames and tibbles.

Sparklyr Cheatsheet
Sparklyr provides an R interface to Apache Spark, a fast and general engine for processing Big Data. With sparklyr, you can connect to a local or remote Spark session, use dplyr to manipulate data in Spark, and run Spark’s built in machine learning algorithms.

R Markdown Cheatsheet
R Markdown is an authoring format that makes it easy to write reusable reports with R. You combine your R code with narration written in markdown (an easy-to-write plain text format) and then export the results as an html, pdf, or Word file. You can even use R Markdown to build interactive documents and slideshows.

RStudio IDE Cheatsheet
The RStudio IDE is the most popular integrated development environment for R. Do you want to write, run, and debug your own R code? Work collaboratively on R projects with version control? Build packages or create documents and apps? No matter what you do with R, the RStudio IDE can help you do it faster. This cheatsheet will guide you through the most useful features of the IDE, as well as the long list of keyboard shortcuts built into the RStudio IDE.

Shiny Cheatsheet
If you’re ready to build interactive web apps with R, say hello to Shiny. This cheatsheet provides a tour of the Shiny package and explains how to build and customize an interactive app. Be sure to follow the links on the sheet for even more information.

Data Visualization Cheatsheet
The ggplot2 package lets you make beautiful and customizable plots of your data. It implements the grammar of graphics, an easy to use system for building plots. See docs.ggplot2.org for detailed examples.

Package Development Cheatsheet
The devtools package makes it easy to build your own R packages, and packages make it easy to share your R code. Supplement this cheatsheet with r-pkgs.had.co.nz, Hadley’s book on package development.

Subject:
Applied Science
Life Science
Physical Science
Social Science
Material Type:
Student Guide
Provider:
RStudio
Author:
RStudio
Date Added:
08/07/2020
ReproducibiliTea
Read the Fine Print
Rating
0.0 stars

Everything you need to know about this ECR-led journal club initiative that helps early career researchers create local Open Science groups that discuss issues, papers and ideas to do with improving science.

Subject:
Applied Science
Life Science
Physical Science
Social Science
Material Type:
Lesson
Provider:
UK Reproducibility Network
Date Added:
06/18/2020
Reproducibility Immersive Course
Conditional Remix & Share Permitted
CC BY-SA
Rating
0.0 stars

Various fields in the natural and social sciences face a ‘crisis of confidence’. Broadly, this crisis amounts to a pervasiveness of non-reproducible results in the published literature. For example, in the field of biomedicine, Amgen published findings that out of 53 landmark published results of pre-clinical studies, only 11% could be replicated successfully. This crisis is not confined to biomedicine. Areas that have recently received attention for non-reproducibility include biomedicine, economics, political science, psychology, as well as philosophy. Some scholars anticipate the expansion of this crisis to other disciplines.This course explores the state of reproducibility. After giving a brief historical perspective, case studies from different disciplines (biomedicine, psychology, and philosophy) are examined to understand the issues concretely. Subsequently, problems that lead to non-reproducibility are discussed as well as possible solutions and paths forward.

Subject:
Applied Science
Life Science
Physical Science
Social Science
Material Type:
Activity/Lab
Provider:
New York University
Author:
Vicky Steeves
Date Added:
06/01/2018
Reproducibility, Preservation, and Access to Research with ReproZip and ReproServer
Conditional Remix & Share Permitted
CC BY-SA
Rating
0.0 stars

The adoption of reproducibility remains low, despite incentives becoming increasingly common in different domains, conferences, and journals. The truth is, reproducibility is technically difficult to achieve due to the complexities of computational environments.To address these technical challenges, we created ReproZip, an open-source tool that packs research along with all the necessary information to reproduce it, including data files, software, OS version, and environment variables. Everything is then bundled into an .rpz file, which users can use to reproduce the work with ReproUnzip and an unpacker (Docker, Vagrant, and Singularity). The .rpz file is general and contains rich metadata: more unpackers can be added as needed, better guaranteeing long-term preservation.However, installing the unpackers can still be burdensome for secondary users of ReproZip bundles. In this paper, we will discuss how ReproZip and our new tool ReproServer can be used together to facilitate access to well-preserved, reproducible work. ReproServer is a cloud application that allows users to upload or provide a link to a ReproZip bundle, and then interact with/reproduce the contents from the comfort of their browser. Users are then provided a stable link to the unpacked work on ReproServer they can share with reviewers or colleagues.

Subject:
Applied Science
Life Science
Physical Science
Social Science
Material Type:
Activity/Lab
Provider:
New York University
Author:
Fernando Chirigati
Rémi Rampin
Vicky Steeves
Date Added:
05/31/2019
Research Project Management Using the Open Science Framework
Conditional Remix & Share Permitted
CC BY-NC
Rating
0.0 stars

An introduction to managing, annotating, organizing, archiving, and publishing research data using the Open Science Framework.

Subject:
Applied Science
Life Science
Physical Science
Social Science
Material Type:
Activity/Lab
Provider:
New York University
Author:
Nick Wolf
Vicky Steeves
Date Added:
01/06/2020
Researchers on Ice
Conditional Remix & Share Permitted
CC BY-SA
Rating
0.0 stars

Four Antarctica researchers describe how they keep warm while working in extreme cold, taking lessons from adaptations of wildlife.

Subject:
Applied Science
Environmental Science
Material Type:
Reading
Provider:
Ohio State University College of Education and Human Ecology
Provider Set:
Beyond Penguins and Polar Bears: An Online Magazine for K-5 Teachers
Author:
Carol Landis
Date Added:
10/17/2014
R for Reproducible Scientific Analysis
Unrestricted Use
CC BY
Rating
0.0 stars

This lesson in part of Software Carpentry workshop and teach novice programmers to write modular code and best practices for using R for data analysis. an introduction to R for non-programmers using gapminder data The goal of this lesson is to teach novice programmers to write modular code and best practices for using R for data analysis. R is commonly used in many scientific disciplines for statistical analysis and its array of third-party packages. We find that many scientists who come to Software Carpentry workshops use R and want to learn more. The emphasis of these materials is to give attendees a strong foundation in the fundamentals of R, and to teach best practices for scientific computing: breaking down analyses into modular units, task automation, and encapsulation. Note that this workshop will focus on teaching the fundamentals of the programming language R, and will not teach statistical analysis. The lesson contains more material than can be taught in a day. The instructor notes page has some suggested lesson plans suitable for a one or half day workshop. A variety of third party packages are used throughout this workshop. These are not necessarily the best, nor are they comprehensive, but they are packages we find useful, and have been chosen primarily for their usability.

Subject:
Applied Science
Computer Science
Information Science
Mathematics
Measurement and Data
Material Type:
Module
Provider:
The Carpentries
Author:
Adam H. Sparks
Ahsan Ali Khoja
Amy Lee
Ana Costa Conrado
Andrew Boughton
Andrew Lonsdale
Andrew MacDonald
Andris Jankevics
Andy Teucher
Antonio Berlanga-Taylor
Ashwin Srinath
Ben Bolker
Bill Mills
Bret Beheim
Clare Sloggett
Daniel
Dave Bridges
David J. Harris
David Mawdsley
Dean Attali
Diego Rabatone Oliveira
Drew Tyre
Elise Morrison
Erin Alison Becker
Fernando Mayer
François Michonneau
Giulio Valentino Dalla Riva
Gordon McDonald
Greg Wilson
Harriet Dashnow
Ido Bar
Jaime Ashander
James Balamuta
James Mickley
Jamie McDevitt-Irwin
Jeffrey Arnold
Jeffrey Oliver
John Blischak
Jonah Duckles
Josh Quan
Julia Piaskowski
Kara Woo
Kate Hertweck
Katherine Koziar
Katrin Leinweber
Kellie Ottoboni
Kevin Weitemier
Kiana Ashley West
Kieran Samuk
Kunal Marwaha
Kyriakos Chatzidimitriou
Lachlan Deer
Lex Nederbragt
Liz Ing-Simmons
Lucy Chang
Luke W Johnston
Luke Zappia
Marc Sze
Marie-Helene Burle
Marieke Frassl
Mark Dunning
Martin John Hadley
Mary Donovan
Matt Clark
Melissa Kardish
Mike Jackson
Murray Cadzow
Narayanan Raghupathy
Naupaka Zimmerman
Nelly Sélem
Nicholas Lesniak
Nicholas Potter
Nima Hejazi
Nora Mitchell
Olivia Rata Burge
Paula Andrea Martinez
Pete Bachant
Phil Bouchet
Philipp Boersch-Supan
Piotr Banaszkiewicz
Raniere Silva
Rayna Michelle Harris
Remi Daigle
Research Bazaar
Richard Barnes
Robert Bagchi
Rémi Emonet
Sam Penrose
Sandra Brosda
Sarah Munro
Sasha Lavrentovich
Scott Allen Funkhouser
Scott Ritchie
Sebastien Renaut
Thea Van Rossum
Timothy Eoin Moore
Timothy Rice
Tobin Magle
Trevor Bekolay
Tyler Crawford Kelly
Vicken Hillis
Yuka Takemon
bippuspm
butterflyskip
waiteb5
Date Added:
03/20/2017