This unit is designed to allow students to quantitatively assess how much …
This unit is designed to allow students to quantitatively assess how much water is used for irrigating crops and how this varies across the United States. This unit also has students link water use to the economic value of the crops that are produced--spanning the scientific and economic disciplines. The concepts that students learn here will connect back to the Water Footprint concept that was introduced in Unit 2, as students consider the accuracy of water calculators.
(Note: this resource was added to OER Commons as part of a batch upload of over 2,200 records. If you notice an issue with the quality of the metadata, please let us know by using the 'report' button and we will flag it for consideration.)
Near surface geophysical measurements are performed by moving sensors across the Earth's …
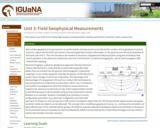
Near surface geophysical measurements are performed by moving sensors across the Earth's surface. Active geophysical sensors transmit a signal into the Earth and record a returned signal that contains information on the physical and chemical properties of the Earth (see Unit 2). This unit introduces the student to the basics of geophysical data acquisition using two techniques that record variations in the electrical conductivity (see Unit 2) of the Earth: [1] electrical imaging (EI), and [2] electromagnetic (EM) conductivity mapping.
Basic concept of electrical imaging measurements
Provenance: Lee Slater, Rutgers University-Newark Reuse: This item is in the public domain and maybe reused freely without restriction. Electrical imaging is a galvanic geophysical approach whereby electrical contact with the Earth is made directly via electrodes (typically metal stakes) that are inserted into the ground. Electromagnetic conductivity mapping is a non-contact approach whereby the physics of EM induction is used to sense changes in electrical conductivity. The advantages and disadvantages of using galvanic (EI) and non-contact (EM) techniques for measuring electrical conductivity are described. Ohm's Law is introduced and students investigate how electrical resistance measurements are related to the electrical conductivity of soils. Field implementation of both EI and EM techniques is demonstrated using surveys performed in Harrier Meadow as an example. Students investigate how variations in survey configuration parameters (e.g. electrode configuration and electrode spacing in EI, frequency and coil spacing in EM) control investigation depth (how far into the ground the signals sense) and spatial resolution (what size objects can be detected). The concept of pre-modeling a geophysical survey (i.e. running some simulations of likely effectiveness of the methods before going to the field) to evaluate expected investigation depth and sensitivity is introduced. The Excel-based Scenario Evaluator for Electrical Resistivity (SEER) tool provided by the United States Geological Survey (USGS) is used to demonstrate some key concepts.
(Note: this resource was added to OER Commons as part of a batch upload of over 2,200 records. If you notice an issue with the quality of the metadata, please let us know by using the 'report' button and we will flag it for consideration.)
In this unit students will explore surface water and its relationship to …
In this unit students will explore surface water and its relationship to the water cycle via watersheds and drainage divides. These topics will inform their analysis of the social and environmental impacts of the planned increase of hydroelectric dams in the Amazon. Case studies include the Ene River and the MaraÃÃn River in Peru.
(Note: this resource was added to OER Commons as part of a batch upload of over 2,200 records. If you notice an issue with the quality of the metadata, please let us know by using the 'report' button and we will flag it for consideration.)
Ruth Hoff, Wittenberg University. Authored and compiled new case study material based on Unit 3 of Environmental Justice and Freshwater Resources module by Adriana Perez, Jill S. Schneiderman, Meg Stewart, and Joshua Villalobos
In this unit, students examine detailed hydrologic data from one river to …
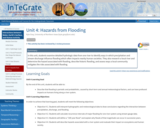
In this unit, students examine detailed hydrologic data from one river to identify ways in which precipitation and stream discharge influence flooding which often impacts nearby human societies. They also research a local river and determine the hazard associated with flooding, describe historic flooding, and assess ways a local community mitigates the risks associated with flooding.
(Note: this resource was added to OER Commons as part of a batch upload of over 2,200 records. If you notice an issue with the quality of the metadata, please let us know by using the 'report' button and we will flag it for consideration.)
The concepts of forward modeling and inverse modeling Provenance: Lee Slater, Rutgers …
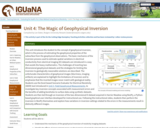
The concepts of forward modeling and inverse modeling
Provenance: Lee Slater, Rutgers University-Newark Reuse: If you wish to use this item outside this site in ways that exceed fair use (see http://fairuse.stanford.edu/) you must seek permission from its creator. This unit introduces the student to the concept of geophysical inversion, which is the process of estimating the geophysical properties of the subsurface from the geophysical observations. The basic mechanics of the inversion process used to estimate spatial variations in electrical conductivity from electrical imaging (EI) datasets are introduced in a way that avoids the heavy mathematics. The challenges of inverting two dimensional geophysical datasets and the strategies for limiting the inversion to geologically reasonable solutions are described. The unfortunate characteristics of geophysical images (blurriness, imaging artifacts) are explained to highlight the limitations of inversion and to emphasize that the inverted images never match with geological reality. Students use the Excel-based Scenario Evaluator for Electrical Resistivity (SEER) tool introduced in Unit 3, Field Geophysical Measurements, to investigate key inversion concepts associated with measurement errors and the benefits of adding boreholes to surface data using synthetic datasets. Students are then led through an inversion of the two-dimensional EI dataset acquired in Harrier Meadow using ResIPy, a Python-based graphical user interface developed for instructional use. Following the instructional video, students then perform the inversion in ResIPy themselves and explore how variations in inversion settings related to the errors in the measurements result in distinctly different images.
(Note: this resource was added to OER Commons as part of a batch upload of over 2,200 records. If you notice an issue with the quality of the metadata, please let us know by using the 'report' button and we will flag it for consideration.)
The California Drought of 2012 -- 2016 had significant social and economic …
The California Drought of 2012 -- 2016 had significant social and economic consequences. This final unit focuses on this drought as a case study for measuring the hydrologic system so that we can better understand fluxes, variability, uncertainties, and methods to measure them. Students analyze a variety of data that are relevant to basin-scale water budget: precipitation, terrestrial water storage, and snow pack. Traditional monitoring systems used are precipitation and snow pillow sensors. The newer geodetic methods are GRACE (Gravity Recovery and Climate Experiment satellite) and Reflection GPS. The students then use these data to consider water storage changes during the drought and how these changes compare in magnitude to human consumption. The work can start during a lab period and carry over into work outside of the lab time. The student exercise takes the form of responses to questions and tasks that tests a student's abilities to synthesize information and identify challenges in monitoring the terrestrial water cycle. Students then take the step-by-step exercise results and synthesize it into a report for California water policy makers to highlight the findings and pro/cons/uncertainties for the different methods. Unit 4 is the summative assessment for the module.
Show more information on GPS versus GNSS Hide Note: Although the term GPS (Global Positioning System) is more commonly used in everyday language, it officially refers only to the USA's constellation of satellites. GNSS (Global Navigation Satellite System) is a universal term that refers to all satellite navigation systems including those from the USA (GPS), Russia (GLONASS), European Union (Galileo), China (BeiDou), and others. In this module, we use the term GPS even though, technically, some of the data may be coming from satellites in other systems.
Show more about Online Teaching suggestions Hide Online-ready: The exercise is electronic and could be done individually or in small online groups. Lecture is best done synchronously due to the technical nature.
(Note: this resource was added to OER Commons as part of a batch upload of over 2,200 records. If you notice an issue with the quality of the metadata, please let us know by using the 'report' button and we will flag it for consideration.)
Students explore water quality and freshwater access issues around the globe. The …
Students explore water quality and freshwater access issues around the globe. The activities require students to investigate region-specific water problems in different parts of the world and analyze how those issues are sometimes remedied. The materials in this unit may be used as a stand-alone day of instruction or as part of the complete Environmental Justice and Freshwater Resources InTeGrate Module.
(Note: this resource was added to OER Commons as part of a batch upload of over 2,200 records. If you notice an issue with the quality of the metadata, please let us know by using the 'report' button and we will flag it for consideration.)
Units 3 and 4 of this module explored how water resources are …
Units 3 and 4 of this module explored how water resources are used for agriculture in the United States and how this can vary depending on location. In Unit 5, students explore how agricultural practices can affect the water quality in streams, rivers, lakes, and coastal areas. Important concepts in this unit include processes that transport suspended material (e.g., sediment) and dissolved material (e.g., nutrients) away from crop fields and into regional water bodies. The effects of dissolved nutrients on the health of the water ecosystems will be presented with examples of hypoxic zones in coastal areas and lake eutrophication. This last unit is well-suited to foster student advancement in systems thinking.
(Note: this resource was added to OER Commons as part of a batch upload of over 2,200 records. If you notice an issue with the quality of the metadata, please let us know by using the 'report' button and we will flag it for consideration.)
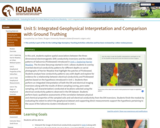
Screenshot of the slider tool used to relate geophysical images to vegetation …
Screenshot of the slider tool used to relate geophysical images to vegetation pattern
Provenance: Lee Slater, Rutgers University-Newark Reuse: This item is in the public domain and maybe reused freely without restriction. In this unit, students explore spatial associations between the three-dimensional electromagnetic (EM) conductivity inversions and the visible patterns of Salicornia (Pickleweed) introduced in Unit 1, Exploring Harrier Meadow. The Arcview Storymap started in Unit 1 allows students to overlay inverted electrical conductivity patterns for different depths on aerial photographs of Harrier Meadow that highlight the patches of Pickleweed. Students analyze how conductivity patterns vary with depth and explore for evidence for a relationship between electrical conductivity and Pickleweed patches based on the hypothesis introduced in Unit 1. Students then perform an integrated interpretation of both the EM and electrical imaging inversions along with the results of direct sampling (coring, pore water sampling, soil characterization) conducted at locations selected using the electrical conductivity patterns observed in the EM dataset. Students perform basic qualitative assessments of the correlation between physical and chemical properties of the sampled soils and soil electrical conductivity from the EM inversions. Students finish the module by evaluating the extent to which the geophysical dataset and supporting direct measurements support the hypothesis pertaining to the cause of the Salicornia clusters introduced in Unit 1.
(Note: this resource was added to OER Commons as part of a batch upload of over 2,200 records. If you notice an issue with the quality of the metadata, please let us know by using the 'report' button and we will flag it for consideration.)
Unit 7 continues the use of the CME Building Case Study to …
Unit 7 continues the use of the CME Building Case Study to explore water sustainability in the context of a building. The activity is extended to the catchment level, and a new tool for catchment level storm water management is introduced. Students are exposed in the pre-class assignments to low impact development (LID) and green infrastructure and the EPA National Stormwater Calculator. In class, the central activity is applying the EPA National Stormwater Calculator to evaluate an LID control plan for the CME building case study. The unit brings together concepts from previous units through the use of the calculator. The impact of landscapes, buildings, and other features on storm water runoff is illustrated. And the potential benefit of LID controls is analyzed. The homework assignment engages students in the search for a local green infrastructure site to take a picture and summarize the site in the context of a sustainable site.
(Note: this resource was added to OER Commons as part of a batch upload of over 2,200 records. If you notice an issue with the quality of the metadata, please let us know by using the 'report' button and we will flag it for consideration.)
In preparation for the activity a lecture is given on the properties …
In preparation for the activity a lecture is given on the properties and history of polychlorinated biphenyls and other contaminants. Each student is assigned to one of six groups with an interest in the outcome of the debate. The teams must meet and prepare a position paper on the proposed environmental dredging in the Upper Hudson River. Each team must represent the interests of its assigned constituency. Data and background information is found on the world wide web and from the instructor's collection of related articles. On the day of the debate the student's orally present their position paper (some make posters or powerpoint presentations). After each group has made their opening statement the invited guest senators on the panel (other faculty, myself, interested students, those who were absent for the preparation) ask each group a series of questions related to their stance. After this a general debate begins with detailed and sometimes heated discussions between the groups and the panel. A few moments are saved at the end of class and everyone is allowed to drop their assumed affiliation and speak their mind on what should be done. Before leaving the class is give a series of big picture topics to think about over the weekend and these are discussed during the next class.
(Note: this resource was added to OER Commons as part of a batch upload of over 2,200 records. If you notice an issue with the quality of the metadata, please let us know by using the 'report' button and we will flag it for consideration.)
In 1978, the Egyptians constructed a canal known as the Toshka Spillway …
In 1978, the Egyptians constructed a canal known as the Toshka Spillway from Lake Nasser into a low area to the west to allow spillover of Lake Nasser water. Despite the fact that the spillway was created in 1978, it wasn't until the late 1990s that Lake Nasser actually filled up to the level of the spillway canal and the overflow lakes began to form. In November of 1998, US astronauts orbiting in the Space Shuttle noticed the lakes filling for the first time, and they have had water in them ever since.
Egypt has embarked on a long-term and far-reaching irrigation plan to create habitable land away from the Nile River Valley. The Toshka Lakes are not, however, a formal part of the project. One of the main points of the exercise is to have students use both their knowledge of Saharan hydrogeology and GIS analyses to evaluate whether the Egyptians are wise not to use the lakes as part of the proposed system of water distribution.
In this exercise, students download and prepare their own SRTM DEMs and learn how to determine areas and volumes using ArcGIS. They can then ask questions and use ArcGIS to determine the answers. How much water is in the Toshka Lakes? What happens if Lake Nasser rises and more water flows down the canal? Will more lakes form, or will the lakes that are there just get bigger? How much water might be evaporating from the lake surfaces? How much water has to flow down the canal to keep the lakes at a particular level? What might happen as the annual Nile flood fluctuates from year to year?
The document posted for downloading contains two homework assignments, two in-class activities, and a wrap-up assignment. You can also download a GIS Primer (Acrobat (PDF) PRIVATE FILE 1.2MB Mar30 10) that we have written, which is a simple GIS "how-to" manual for tasks including those used in this exercise.
(Note: this resource was added to OER Commons as part of a batch upload of over 2,200 records. If you notice an issue with the quality of the metadata, please let us know by using the 'report' button and we will flag it for consideration.)
This activity uses field measurements and GIS to estimate the volume of …
This activity uses field measurements and GIS to estimate the volume of water in the form of snow in a field site.
(Note: this resource was added to OER Commons as part of a batch upload of over 2,200 records. If you notice an issue with the quality of the metadata, please let us know by using the 'report' button and we will flag it for consideration.)
This activity is an inquiry based field investigation where students measure and …
This activity is an inquiry based field investigation where students measure and map a small stream and then develop an understanding of the formation of a variety of small stream features.
Wetlands provide an ideal field hydrology laboratory because the water table is …
Wetlands provide an ideal field hydrology laboratory because the water table is so close to the land surface. Eight field exercises, in which students generate their own data, are presented that demonstrate surface-water, vadose-zone, and groundwater hydrology concepts. Standard field equipment and methods are used to conduct investigations including measuring stream discharge, estimating groundwater seepage to a stream and/or pond, preparing a topographic profile showing the water-table configuration, measuring infiltration rates and estimating constant infiltration capacity, measuring field-saturated hydraulic conductivity, estimating hydraulic conductivity from slug tests, and determining the direction, hydraulic gradient, and specific discharge of groundwater. These labs compliment lecture material commonly covered in a first semester hydrology course.
(Note: this resource was added to OER Commons as part of a batch upload of over 2,200 records. If you notice an issue with the quality of the metadata, please let us know by using the 'report' button and we will flag it for consideration.)
Students use a microcomputer connected to a conductivity probe to measure the …
Students use a microcomputer connected to a conductivity probe to measure the total dissolved solids in local area water samples.
(Note: this resource was added to OER Commons as part of a batch upload of over 2,200 records. If you notice an issue with the quality of the metadata, please let us know by using the 'report' button and we will flag it for consideration.)
This activity is taken from Earth Science With Vernier by Robyn Johnson, Gretchen Stahmer DeMoss, and Richard Sorensen, Published by , Vernier Software (more info) . This Starting Point page was created by Robert MacKay, of Clark College .
Students conduct a regional watershed analysis of an area of their choosing. …
Students conduct a regional watershed analysis of an area of their choosing. Using on-line data and their personal knowledge of the area, they determine the annual hydrologic budget and teach the class about "their" watershed.
(Note: this resource was added to OER Commons as part of a batch upload of over 2,200 records. If you notice an issue with the quality of the metadata, please let us know by using the 'report' button and we will flag it for consideration.)
Students learn about the water cycle and its key components. First, they …
Students learn about the water cycle and its key components. First, they learn about the concept of a watershed and why it is important in the context of engineering hydrology. Then they learn how we can use the theory of conservation of mass to estimate the amount of water that enters a watershed (precipitation, groundwater flowing in) and exits a watershed (evaporation, runoff, groundwater out). Finally, students learn about runoff and how we visualize runoff in the form of hydrographs.
Students read one of two articles (the "cases") from High Country News, …
Students read one of two articles (the "cases") from High Country News, a bi-weekly periodical that covers environmental issues in the western North America. Both articles are about situations in which the use of ground water by irrigators has decreased the amount of surface water available for users with senior water rights. I divide the class into groups representing 1) surface water users, 2) ground water users, and 3) a regulatory board. The groups read and discuss each article and prepare a case to present to the regulatory board. After each group has prepared their case, we gather for a hearing, where groups of consultants present their cases and are questioned by the regulatory board. At the end, the regulatory board makes "decisions" on each "case". The decision isn't the focus of the exercise. The most valuable part is the subsequent discussion about the cases and the common issues in them that get the students to recognize the connection between surface and ground water and how humans have come up with confusing and sometimes scientifically conflicting sets of laws to regulate each.
(Note: this resource was added to OER Commons as part of a batch upload of over 2,200 records. If you notice an issue with the quality of the metadata, please let us know by using the 'report' button and we will flag it for consideration.)
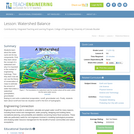
Students are provided with a 3D perspective of a virtual place, descriptions …
Students are provided with a 3D perspective of a virtual place, descriptions of geologic and cultural aspects, and a table with water-table elevations in groundwater and contaminant levels in water wells, springs, and rivers. Students use these data to contour water-table elevations, determine the direction of groundwater flow, and identify industrial sites that are likely sources of contamination. They then propose a remediation plan and identify water wells that are likely to remain uncontaminated in the future.
(Note: this resource was added to OER Commons as part of a batch upload of over 2,200 records. If you notice an issue with the quality of the metadata, please let us know by using the 'report' button and we will flag it for consideration.)
No restrictions on your remixing, redistributing, or making derivative works. Give credit to the author, as required.
Your remixing, redistributing, or making derivatives works comes with some restrictions, including how it is shared.
Your redistributing comes with some restrictions. Do not remix or make derivative works.
Most restrictive license type. Prohibits most uses, sharing, and any changes.
Copyrighted materials, available under Fair Use and the TEACH Act for US-based educators, or other custom arrangements. Go to the resource provider to see their individual restrictions.