In this example, students learn how to read a topographic map and …
In this example, students learn how to read a topographic map and understand map contours. This resource is from PUMAS - Practical Uses of Math and Science - a collection of brief examples created by scientists and engineers showing how math and science topics taught in K-12 classes have real world applications.
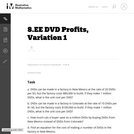
This write-pair-share activity for Calculus II students involves a hypothetical hemispherical loaf …
This write-pair-share activity for Calculus II students involves a hypothetical hemispherical loaf of bread with a 12-inch diameter that has been sliced into twelve one-inch-thick slices. The objective is to determine which slice contains the most upper crust (i.e., most area of its surface of revolution).
An interactive applet and associated web page that demonstrate the properties of …
An interactive applet and associated web page that demonstrate the properties of a cube. A 3-D cube is shown in the applet which can be interactively manipulated using the mouse. Research has shown that some younger students have difficulty visualizing the parts of a 3D object that are hidden. To help with this, the student can rotate the cube in any axis simply by dragging it with the mouse. It can also be 'exploded' - where a slider gradually separates the faces to reveal the ones behind. The cube can also be made translucent so you see through it to the other side. Applet can be enlarged to full screen size for use with a classroom projector, and printed to make handouts. This resource is a component of the Math Open Reference Interactive Geometry textbook project at http://www.mathopenref.com.
One common mistake students make when dividing fractions using visuals is the …
One common mistake students make when dividing fractions using visuals is the confusion between remainder and the fractional part of a mixed number answer.
With your mouse, drag data points and their error bars, and watch …
With your mouse, drag data points and their error bars, and watch the best-fit polynomial curve update instantly. You choose the type of fit: linear, quadratic, cubic, or quartic. The reduced chi-square statistic shows you when the fit is good. Or you can try to find the best fit by manually adjusting fit parameters.
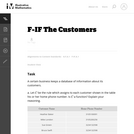
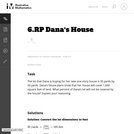
The purpose of this task is to introduce or reinforce the concept …
The purpose of this task is to introduce or reinforce the concept of a function, especially in a context where the function is not given by an explicit algebraic representation. Further, the last part of the task emphasizes the significance of one variable being a function of another variable in an immediately relevant real-life context.
In Math, students will draw a t-chart to represent dam and flood …
In Math, students will draw a t-chart to represent dam and flood data obtained from their reading resource. Students will select the information they wish to use from the reading resource (their opinions). Students will then use rulers marked with halves and fourths of an inch to measure lengths and construct a scale model of their own dam, which they can later construct in Science. Students will represent data in a graph and use measurement data by measuring lengths using rulers marked with halves and fourths of an inch. Students will test their scale dams and make changes as needed. This unit was created as part of the ALEX Interdisciplinary Resource Development Summit.
Students conduct Internet research to investigate the purpose and current functioning status …
Students conduct Internet research to investigate the purpose and current functioning status of some of the largest dams throughout the world. They investigate the success or failure of eight dams and complete a worksheet. While researching the dams, they also gain an understanding of the scale of these structures by recording and comparing their reservoir capacities. Students come to understand that dams, like all engineered structures, have a finite lifespan and require ongoing maintenance and evaluation for their usefulness.
This course introduces methods for harnessing data to answer questions of cultural, social, …
This course introduces methods for harnessing data to answer questions of cultural, social, economic, and policy interest. We will start with essential notions of probability and statistics. We will proceed to cover techniques in modern data analysis: regression and econometrics, design of experiments, randomized control trials (and A/B testing), machine learning, and data visualization. We will illustrate these concepts with applications drawn from real-world examples and frontier research. Finally, we will provide instruction on the use of the statistical package R, and opportunities for students to perform self-directed empirical analyses. MITx Online This course draws materials from 14.310x Data Analysis for Social Scientists, which is part of the MicroMasters Program in Data, Economics, and Design of Policy offered by MITx Online. The MITx Online course is entirely free to audit, though learners have the option to pay a fee, which is based on the learner’s ability to pay, to take the proctored exam and earn a course certificate. To access that course, create an MITx Online account and enroll in the course 14.310x Data Analysis for Social Scientists.
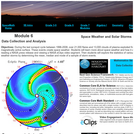
During the last sunspot cycle between 1996-2008, over 21,000 flares and 13,000 …
During the last sunspot cycle between 1996-2008, over 21,000 flares and 13,000 clouds of plasma exploded from the Sun's magnetically active surface. These events create space weather. Students will learn more about space weather and how it affects Earth through reading a NASA press release and viewing a NASA eClips video segment. Then students will explore the statistics of various types of space weather storms by determining the mean, median and mode of a sample of storm events. This activity is part of the Space Math multimedia modules that integrate NASA press releases, NASA archival video, and mathematics problems targeted at specific math standards commonly encountered in middle school textbooks. The modules cover specific math topics at multiple levels of difficulty with real-world data and use the 5E instructional sequence.
No restrictions on your remixing, redistributing, or making derivative works. Give credit to the author, as required.
Your remixing, redistributing, or making derivatives works comes with some restrictions, including how it is shared.
Your redistributing comes with some restrictions. Do not remix or make derivative works.
Most restrictive license type. Prohibits most uses, sharing, and any changes.
Copyrighted materials, available under Fair Use and the TEACH Act for US-based educators, or other custom arrangements. Go to the resource provider to see their individual restrictions.